Page 568 - MODUL SPEKTRUM FIZIK SPM
P. 568

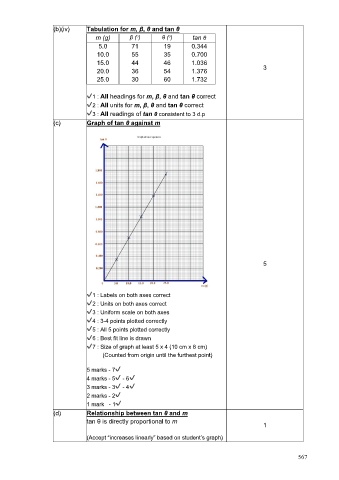
(b)(iv)    Tabulation for m, β, θ and tan θ
                                                 o
                                                            o
                                   m (g)       β ( )      θ ( )      tan θ
                                    5.0        71          19       0.344
                                   10.0        55          35       0.700
                                   15.0        44          46       1.036
                                   20.0        36          54       1.376                    3
                                   25.0        30          60       1.732

                               ✔1 : All headings for m, β, θ and tan θ correct
                               ✔2 : All units for m, β, θ and tan θ correct
                               ✔3 : All readings of tan θ consistent to 3 d.p
                    (c)        Graph of tan θ against m


                                                                                             5


                               ✔1 : Labels on both axes correct
                               ✔2 : Units on both axes correct
                               ✔3 : Uniform scale on both axes
                               ✔4 : 3-4 points plotted correctly
                               ✔5 : All 5 points plotted correctly
                               ✔6 : Best fit line is drawn
                               ✔7 : Size of graph at least 5 x 4 (10 cm x 8 cm)
                                         (Counted from origin until the furthest point)

                               5 marks - 7✔
                               4 marks - 5✔ - 6✔
                               3 marks - 3✔ - 4✔
                               2 marks - 2✔
                               1 mark   - 1✔
                    (d)        Relationship between tan θ and m
                               tan θ is directly proportional to m                           1

                               (Accept “increases linearly” based on student’s graph)


                                                                                                          567
   563   564   565   566   567   568   569   570   571   572   573