Page 573 - MODUL SPEKTRUM FIZIK SPM
P. 573

2
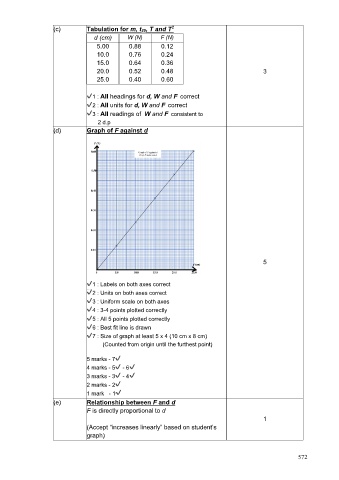
                    (c)        Tabulation for m, t20, T and T
                                  d (cm)      W (N)      F (N)
                                   5.00       0.88        0.12
                                   10.0       0.76        0.24
                                   15.0       0.64        0.36
                                   20.0       0.52        0.48                               3
                                   25.0       0.40        0.60


                               ✔1 : All headings for d, W and F  correct

                               ✔2 : All units for d, W and F  correct

                               ✔3 : All readings of  W and F  consistent to
                                      2 d.p
                    (d)        Graph of F against d


                                                                                             5


                               ✔1 : Labels on both axes correct
                               ✔2 : Units on both axes correct
                               ✔3 : Uniform scale on both axes
                               ✔4 : 3-4 points plotted correctly
                               ✔5 : All 5 points plotted correctly
                               ✔6 : Best fit line is drawn
                               ✔7 : Size of graph at least 5 x 4 (10 cm x 8 cm)
                                         (Counted from origin until the furthest point)

                               5 marks - 7✔
                               4 marks - 5✔ - 6✔
                               3 marks - 3✔ - 4✔
                               2 marks - 2✔
                               1 mark   - 1✔
                    (e)        Relationship between F and d
                               F is directly proportional to d
                                                                                             1
                               (Accept “increases linearly” based on student’s
                               graph)


                                                                                                          572
   568   569   570   571   572   573   574   575   576   577   578