
Page 135 - 2018 Comprehensive Annual Financial Report - City of Winston-Salem
P. 135
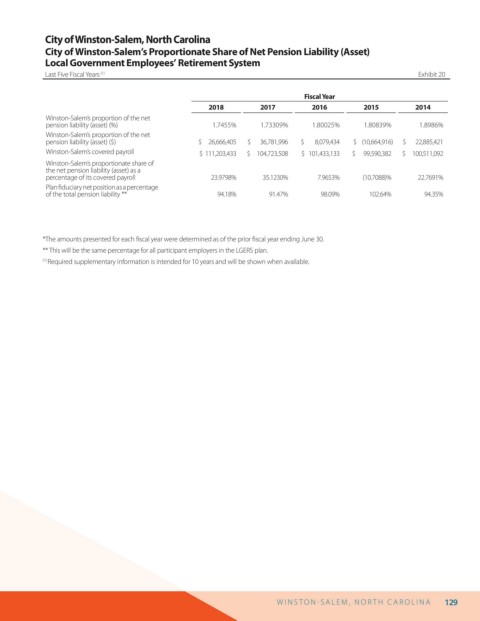
City of Winston-Salem, North Carolina
                  City of Winston-Salem’s Proportionate Share of Net Pension Liability (Asset)
                  Local Government Employees’ Retirement System

                  Last Five Fiscal Years  (1)                                                                    Exhibit 20

                                                                                    Fiscal Year
                                                            2018         2017         2016         2015          2014
                  Winston-Salem’s proportion of the net
                  pension liability (asset) (%)              1.7455%     1.73309%     1.80025%      1.80839%      1.8986%
                  Winston-Salem’s proportion of the net
                  pension liability (asset) ($)          $     26,666,405   $       36,781,996  $        8,079,434  $    (10,664,916)  $       22,885,421
                  Winston-Salem’s covered payroll         $  111,203,433  $     104,723,508  $   101,433,133  $      99,590,382  $     100,511,092
                  Winston-Salem’s proportionate share of
                  the net pension liability (asset) as a
                  percentage of its covered payroll          23.9798%     35.1230%      7.9653%    (10.7088)%    22.7691%
                  Plan  duciary net position as a percentage
                  of the total pension liability **           94.18%       91.47%        98.09%      102.64%       94.35%


                  *The amounts presented for each  scal year were determined as of the prior  scal year ending June 30.
                  ** This will be the same percentage for all participant employers in the LGERS plan.
                  (1)  Required supplementary information is intended for 10 years and will be shown when available.


                                                                             W I N S T O N   S AL E M ,  N O R T H  C AR O L I N A  129