
Page 132 - 2018 Comprehensive Annual Financial Report - City of Winston-Salem
P. 132
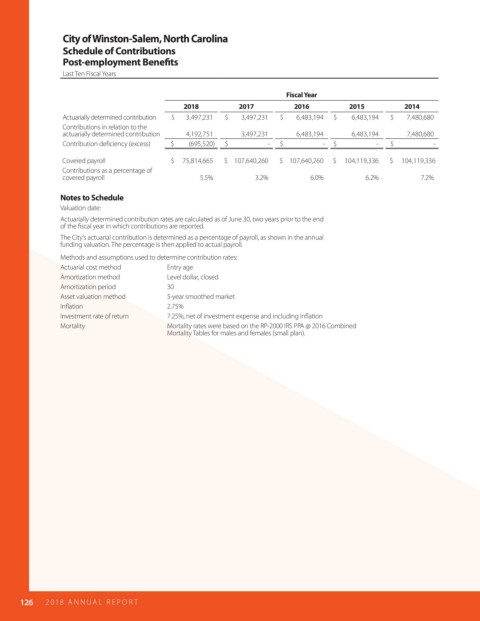
City of Winston-Salem, North Carolina

                       Schedule of Contributions
                       Post-employment Bene ts

                       Last Ten Fiscal Years

                                                                                Fiscal Year
                                                      2018          2017          2016          2015          2014
                       Actuarially determined contribution  $       3,497,231  $        3,497,231  $        6,483,194  $         6,483,194  $        7,480,680
                       Contributions in relation to the
                       actuarially determined contribution  4,192,751  3,497,231  6,483,194     6,483,194      7,480,680
                       Contribution de ciency (excess)  $         (695,520)  $                         -  $                         -  $                         -  $                         -
                       Covered payroll            $     75,814,665  $    107,640,260  $    107,640,260  $     104,119,336  $     104,119,336
                       Contributions as a percentage of
                       covered payroll                    5.5%          3.2%          6.0%           6.2%         7.2%

                      Notes to Schedule
                      Valuation date:
                      Actuarially determined contribution rates are calculated as of June 30, two years prior to the end
                      of the  scal year in which contributions are reported.
                      The City’s actuarial contribution is determined as a percentage of payroll, as shown in the annual
                      funding valuation. The percentage is then applied to actual payroll.
                      Methods and assumptions used to determine contribution rates:
                      Actuarial cost method      Entry age
                      Amortization method        Level dollar, closed
                      Amortization period        30
                      Asset valuation method     5-year smoothed market
                      In ation                   2.75%
                      Investment rate of return  7.25%, net of investment expense and including in ation
                      Mortality                  Mortality rates were based on the RP-2000 IRS PPA @ 2016 Combined
                                                 Mortality Tables for males and females (small plan).


            126   2018  AN NUAL  R E P O R T