Page 142 - 2018 Comprehensive Annual Financial Report - City of Winston-Salem
P. 142

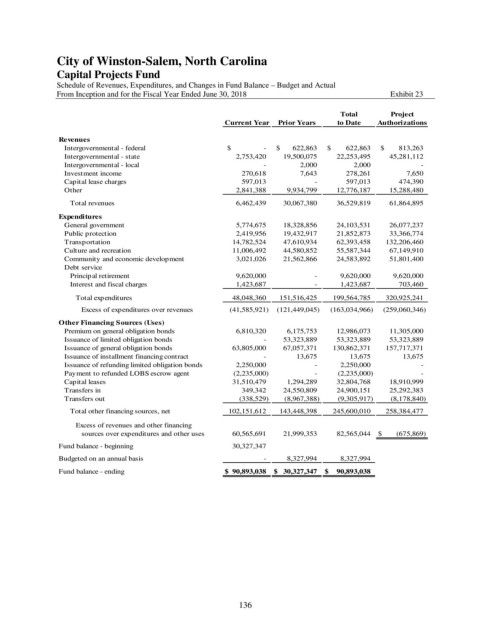
City of Winston-Salem, North Carolina
               Capital Projects Fund

               Schedule of Revenues, Expenditures, and Changes in Fund Balance – Budget and Actual
               From Inception and for the Fiscal Year Ended June 30, 2018                            Exhibit 23

                                                                                        Total        Project
                                                          Current Year  Prior Years    to Date   Authorizations
                Revenues
                 Intergovernmental - federal               $                   -  $        622,863  $          622,863  $         813,263
                 Intergovernmental - state                       2,753,420       19,500,075         22,253,495        45,281,112
                 Intergovernmental - local                                      -                2,000                  2,000                         -
                 Investment income                                  270,618                7,643              278,261                 7,650
                 Capital lease charges                              597,013                        -              597,013             474,390
                 Other                                           2,841,388         9,934,799         12,776,187        15,288,480
                   Total revenues                                6,462,439       30,067,380         36,529,819        61,864,895
                Expenditures
                 General government                              5,774,675       18,328,856         24,103,531        26,077,237
                 Public protection                               2,419,956       19,432,917         21,852,873        33,366,774
                 Transportation                                14,782,524       47,610,934         62,393,458      132,206,460
                 Culture and recreation                        11,006,492       44,580,852         55,587,344        67,149,910
                 Community and economic development              3,021,026       21,562,866         24,583,892        51,801,400
                 Debt service
                   Principal retirement                          9,620,000                        -           9,620,000          9,620,000
                   Interest and fiscal charges                   1,423,687                        -           1,423,687             703,460

                    Total expenditures                         48,048,360     151,516,425       199,564,785      320,925,241
                      Excess of expenditures over revenues     (41,585,921)    (121,449,045)     (163,034,966)     (259,060,346)
                Other Financing Sources (Uses)
                 Premium on general obligation bonds             6,810,320         6,175,753         12,986,073        11,305,000
                 Issuance of limited obligation bonds                           -       53,323,889         53,323,889        53,323,889
                 Issuance of general obligation bonds          63,805,000       67,057,371       130,862,371      157,717,371
                 Issuance of installment financing contract                       -              13,675                13,675               13,675
                 Issuance of refunding limited obligation bonds        2,250,000                        -           2,250,000                         -
                 Payment to refunded LOBS escrow agent          (2,235,000)                        -         (2,235,000)                         -
                 Capital leases                                31,510,479         1,294,289         32,804,768        18,910,999
                 Transfers in                                       349,342       24,550,809         24,900,151        25,292,383
                 Transfers out                                     (338,529)        (8,967,388)         (9,305,917)         (8,178,840)

                   Total other financing sources, net        102,151,612     143,448,398       245,600,010      258,384,477

                    Excess of revenues and other financing
                      sources over expenditures and other uses      60,565,691       21,999,353         82,565,044  $         (675,869)

                Fund balance - beginning                       30,327,347
                Budgeted on an annual basis                                     -  8,327,994           8,327,994
                Fund balance - ending                     $    90,893,038  $     30,327,347  $      90,893,038


                                                              136
   137   138   139   140   141   142   143   144   145   146   147