Page 143 - 2018 Comprehensive Annual Financial Report - City of Winston-Salem
P. 143

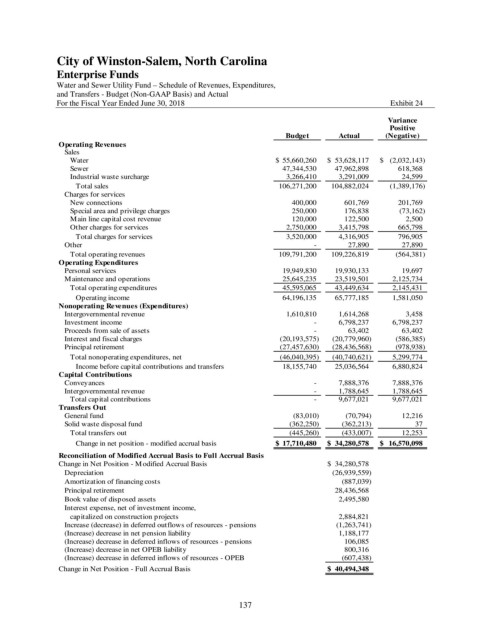
City of Winston-Salem, North Carolina
               Enterprise Funds

               Water and Sewer Utility Fund – Schedule of Revenues, Expenditures,
               and Transfers - Budget (Non-GAAP Basis) and Actual
               For the Fiscal Year Ended June 30, 2018                                               Exhibit 24

                                                                                                    Variance
                                                                                                    Positive
                                                                          Budget       Actual      (Negative)
                Operating Revenues
                 Sales
                   Water                                               $   55,660,260  $    53,628,117  $     (2,032,143)
                   Sewer                                                    47,344,530      47,962,898            618,368
                   Industrial waste surcharge                                 3,266,410        3,291,009              24,599
                    Total sales                                           106,271,200    104,882,024        (1,389,176)
                 Charges for services
                   New connections                                               400,000           601,769            201,769
                   Special area and privilege charges                            250,000           176,838             (73,162)
                   Main line capital cost revenue                                120,000           122,500                2,500
                   Other charges for services                                 2,750,000        3,415,798            665,798
                    Total charges for services                                3,520,000        4,316,905            796,905
                 Other                                                                       -             27,890              27,890
                   Total operating revenues                               109,791,200    109,226,819           (564,381)
                Operating Expenditures
                 Personal services                                          19,949,830      19,930,133              19,697
                 Maintenance and operations                                 25,645,235      23,519,501         2,125,734
                   Total operating expenditures                             45,595,065      43,449,634         2,145,431
                    Operating income                                        64,196,135      65,777,185         1,581,050
                Nonoperating Revenues (Expenditures)
                 Intergovernmental revenue                                    1,610,810        1,614,268                3,458
                 Investment income                                                           -        6,798,237         6,798,237
                 Proceeds from sale of assets                                                -             63,402              63,402
                 Interest and fiscal charges                               (20,193,575)     (20,779,960)           (586,385)
                 Principal retirement                                      (27,457,630)     (28,436,568)           (978,938)
                   Total nonoperating expenditures, net                    (46,040,395)     (40,740,621)         5,299,774
                    Income before capital contributions and transfers       18,155,740      25,036,564         6,880,824
                Capital Contributions
                 Conveyances                                                                 -  7,888,376         7,888,376
                 Intergovernmental revenue                                                   -        1,788,645         1,788,645
                   Total capital contributions                                               -        9,677,021         9,677,021
                Transfers Out
                 General fund                                               (83,010)     (70,794)              12,216
                 Solid waste disposal fund                                 (362,250)          (362,213)                     37
                   Total transfers out                                     (445,260)    (433,007)       12,253
                    Change in net position - modified accrual basis    $   17,710,480  $    34,280,578  $    16,570,098
                Reconciliation of Modified Accrual Basis to Full Accrual Basis
                Change in Net Position - Modified Accrual Basis                     $    34,280,578
                 Depreciation                                                           (26,939,559)
                 Amortization of financing costs                                             (887,039)
                 Principal retirement                                                    28,436,568
                 Book value of disposed assets                                             2,495,580
                 Interest expense, net of investment income,
                   capitalized on construction projects                                    2,884,821
                 Increase (decrease) in deferred outflows of resources - pensions         (1,263,741)
                 (Increase) decrease in net pension liability                              1,188,177
                 (Increase) decrease in deferred inflows of resources - pensions              106,085
                 (Increase) decrease in net OPEB liability                                    800,316
                 (Increase) decrease in deferred inflows of resources - OPEB                 (607,438)
                Change in Net Position - Full Accrual Basis                         $    40,494,348


                                                              137
   138   139   140   141   142   143   144   145   146   147   148