
Page 58 - Color_Atlas_of_Physiology_5th_Ed._-_A._Despopoulos_2003
P. 58
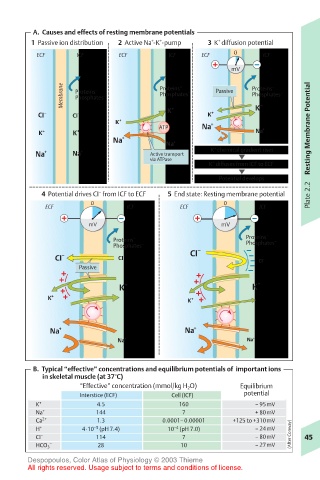
A.  Causes and effects of resting membrane potentials
                                                  +
                                     +
                                   +
        1  Passive ion distribution  2  Active Na -K -pump  3  K diffusion potential
         ECF      ICF       ECF        ICF    ECF     0     ICF
                                                     mV
               Membrane  Proteins –  –  Proteins –  –  Passive  Proteins –  –
                                     Phosphates
                                                          Phosphates
                  Phosphates
          CI –   CI –                  K +      K +       K +
                           K +                  +
                                     ATP      Na            +          Resting Membrane Potential
          K +    K +                                       Na
                          Na +
                                      Na +       +
         Na +    Na +              Active transport  K chemical gradient rises
                                   via ATPase
                                                K  diffuses from ICF to ECF
                                                 +
                                                  Potential develops
                       –
          4  Potential drives CI  from ICF to ECF  5  End state: Resting membrane potential  Plate 2.2
                     0                             0
           ECF                ICF         ECF              ICF
                     mV                            mV
                          Proteins –                    Proteins –  –
                          Phosphates –       –          Phosphates
             CI –           CI –            CI             CI –
                   Passive

                            K +                           K +
            K +                            K +


            Na +                           Na +
                           Na +                          Na +


        B.  Typical “effective” concentrations and equilibrium potentials of  important ions
               in skeletal muscle (at 37°C)
                   “Effective” concentration (mmol/kg H 2 O)  Equilibrium
                   Interstice (ECF)     Cell (ICF)      potential
         K +           4.5               160              – 95mV
         Na +          144                7               + 80mV
         Ca 2+         1.3            0.0001–0.00001  +125 to +310mV
                                        –4
                      –5
         H +       4·10  (pH 7.4)      10  (pH 7.0)       – 24mV
         CI –          114                7               – 80mV  (After Conway)  45
            –                                             – 27mV
         HCO 3         28                 10
       Despopoulos, Color Atlas of Physiology © 2003 Thieme
       All rights reserved. Usage subject to terms and conditions of license.