
Page 95 - 02 รายงานวิชาการจังหวัดประจวบคีรีขันธ์
P. 95
- 73 -
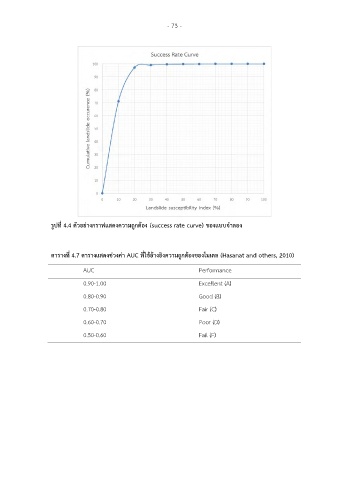
รูปที่ 4.4 ตัวอยางกราฟแสดงความถูกตอง (success rate curve) ของแบบจำลอง
ตารางที่ 4.7 ตารางแสดงชวงคา AUC ที่ใชอางอิงความถูกตองของโมเดล (Hasanat and others, 2010)
AUC Performance
0.90-1.00 Excellent (A)
0.80-0.90 Good (B)
0.70-0.80 Fair (C)
0.60-0.70 Poor (D)
0.50-0.60 Fail (F)