
Page 1427 - Williams Hematology ( PDFDrive )
P. 1427
1402 Part X: Malignant Myeloid Diseases Chapter 88: Acute Myelogenous Leukemia 1403
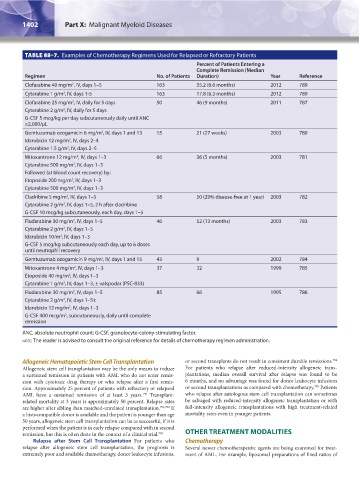
TABLE 88–7. Examples of Chemotherapy Regimens Used for Relapsed or Refractory Patients
Percent of Patients Entering a
Complete Remission (Median
Regimen No. of Patients Duration) Year Reference
Clofarabine 40 mg/m , IV, days 1–5 163 35.2 (6.6 months) 2012 789
2
Cytarabine 1 g/m , IV, days 1-5 163 17.8 (6.3 months) 2012 789
2
Clofarabine 25 mg/m , IV, daily for 5 days 50 46 (9 months) 2011 787
2
Cytarabine 2 g/m , IV, daily for 5 days
2
G-CSF 5 mcg/kg per day subcutaneously daily until ANC
≥2,000/μL
Gemtuzumab ozogamicin 6 mg/m , IV, days 1 and 13 15 21 (27 weeks) 2003 780
2
Idarubicin 12 mg/m , IV, days 2–4
2
2
Cytarabine 1.5 g/m , IV, days 2–5
Mitoxantrone 12 mg/m , IV, days 1–3 66 36 (5 months) 2003 781
2
Cytarabine 500 mg/m , IV, days 1–3
2
Followed (at blood count recovery) by:
Etoposide 200 mg/m , IV, days 1–3
2
Cytarabine 500 mg/m , IV, days 1–3
2
Cladribine 5 mg/m , IV, days 1–5 58 50 (29% disease-free at 1 year) 2003 782
2
Cytarabine 2 g/m , IV, days 1–5, 2 h after cladribine
2
G-CSF 10 mcg/kg subcutaneously, each day, days 1–5
Fludarabine 30 mg/m , IV, days 1–5 46 52 (13 months) 2003 783
2
Cytarabine 2 g/m , IV, days 1–5
2
Idarubicin 10/m , IV, days 1–3
2
G-CSF 5 mcg/kg subcutaneously each day, up to 6 doses
until neutrophil recovery
2
Gemtuzumab ozogamicin 9 mg/m , IV, days 1 and 15 43 9 2002 784
Mitoxantrone 4 mg/m , IV, days 1–3 37 32 1999 785
2
Etoposide 40 mg/m , IV, days 1–3
2
Cytarabine 1 g/m , IV, days 1–3, ± valspodar (PSC-833)
2
Fludarabine 30 mg/m , IV, days 1–5 85 66 1995 786
2
Cytarabine 2 g/m , IV, days 1–5±
2
Idarubicin 12 mg/m , IV, days 1–3
2
G-CSF 400 mcg/m , subcutaneously, daily until complete
2
remission
ANC, absolute neutrophil count; G-CSF, granulocyte-colony-stimulating factor.
note: The reader is advised to consult the original reference for details of chemotherapy regimen administration.
794
Allogeneic Hematopoietic Stem Cell Transplantation or second transplants do not result in consistent durable remissions.
Allogeneic stem cell transplantation may be the only means to induce For patients who relapse after reduced-intensity allogeneic trans-
a sustained remission in patients with AML who do not enter remis- plantations, median overall survival after relapse was found to be
sion with cytotoxic drug therapy or who relapse after a first remis- 6 months, and no advantage was found for donor leukocyte infusions
795
sion. Approximately 25 percent of patients with refractory or relapsed or second transplantations as compared with chemotherapy. Patients
AML have a sustained remission of at least 3 years. Transplant- who relapse after autologous stem cell transplantation can sometimes
790
related mortality at 3 years is approximately 50 percent. Relapse rates be salvaged with reduced-intensity allogeneic transplantation or with
are higher after sibling than matched-unrelated transplantation. 791,792 If full-intensity allogeneic transplantations with high treatment-related
a histocompatible donor is available and the patient is younger than age mortality rates even in younger patients.
50 years, allogeneic stem cell transplantation can be as successful, if it is
performed when the patient is in early relapse compared with in second
remission, but this is often done in the context of a clinical trial. 793 OTHER TREATMENT MODALITIES
Relapse after Stem Cell Transplantation For patients who Chemotherapy
relapse after allogeneic stem cell transplantation, the prognosis is Several newer chemotherapeutic agents are being examined for treat-
extremely poor and available chemotherapy, donor leukocyte infusions, ment of AML. For example, liposomal preparations of fixed ratios of
Kaushansky_chapter 88_p1373-1436.indd 1402 9/21/15 11:02 AM