
Page 220 - HOW TO PROVE IT: A Structured Approach, Second Edition
P. 220
P1: PIG/ P2: OYK/
0521861241c04 CB996/Velleman October 20, 2005 2:54 0 521 86124 1 Char Count= 0
206 Relations
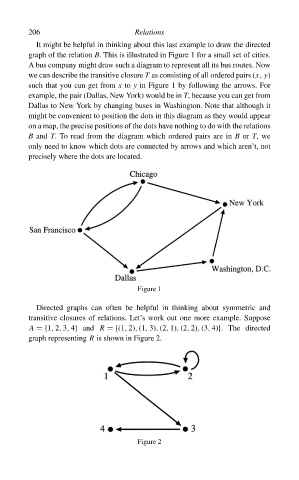
It might be helpful in thinking about this last example to draw the directed
graph of the relation B. This is illustrated in Figure 1 for a small set of cities.
A bus company might draw such a diagram to represent all its bus routes. Now
we can describe the transitive closure T as consisting of all ordered pairs (x, y)
such that you can get from x to y in Figure 1 by following the arrows. For
example, the pair (Dallas, New York) would be in T, because you can get from
Dallas to New York by changing buses in Washington. Note that although it
might be convenient to position the dots in this diagram as they would appear
on a map, the precise positions of the dots have nothing to do with the relations
B and T. To read from the diagram which ordered pairs are in B or T,we
only need to know which dots are connected by arrows and which aren’t, not
precisely where the dots are located.
Figure 1
Directed graphs can often be helpful in thinking about symmetric and
transitive closures of relations. Let’s work out one more example. Suppose
A ={1, 2, 3, 4} and R ={(1, 2), (1, 3), (2, 1), (2, 2), (3, 4)}. The directed
graph representing R is shown in Figure 2.
Figure 2