
Page 7 - TOP CLASS MATHS T5 KSSM
P. 7
CHAPTER Measures of Dispersion for Grouped Data
1 7
Sukatan Serakan Data Terkumpul
7.1 Dispersion pg. 196 – 210
Textbook
Serakan
SMART Notes
1. Grouped data is the data that is grouped into a few (ii) The difference between the upper boundary and the
classes with uniform intervals and the range of each lower boundary of a class interval.
class is called class interval. Beza antara sempadan atas dengan sempadan bawah bagi
Data terkumpul merupakan data yang dikumpulkan dalam beberapa suatu selang kelas.
kelas dengan selang yang seragam. Julat setiap kelas itu dinamakan
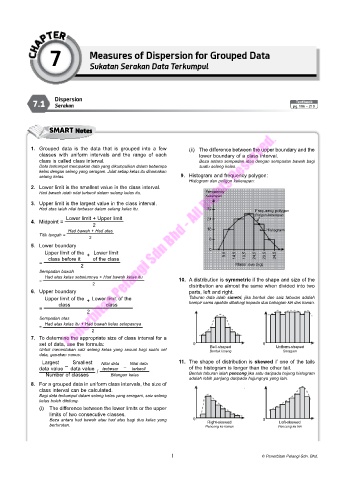
selang kelas. 9. Histogram and frequency polygon:
Histogram dan poligon kekerapan:
2. Lower limit is the smallest value in the class interval.
Had bawah ialah nilai terkecil dalam selang kelas itu. Frequency
Kekerapan
3. Upper limit is the largest value in the class interval.
Had atas ialah nilai terbesar dalam selang kelas itu. 32 Frequency polygon
Poligon kekerapan
Lower limit + Upper limit 24
4. Midpoint =
2
Had bawah + Had atas 16 Histogram
Titik tengah =
2 8
5. Lower boundary
Upper limit of the Lower limit 0 9.5
+
class before it of the class 14.5 19.5 24.5 29.5 34.5
=
2 Mass/ Jisim (kg)
Sempadan bawah
Had atas kelas sebelumnya + Had bawah kelas itu
= 10. A distribution is symmetric if the shape and size of the
2 distribution are almost the same when divided into two
6. Upper boundary parts, left and right.
Upper limit of the Lower limit of the Taburan data ialah simetri, jika bentuk dan saiz taburan adalah
+
class class hampir sama apabila dibahagi kepada dua bahagian kiri dan kanan.
=
2
Sempadan atas
Had atas kelas itu + Had bawah kelas selepasnya
=
2
7. To determine the appropriate size of class interval for a
set of data, use the formula: 0 0
Bell-shaped
Untuk menentukan saiz selang kelas yang sesuai bagi suatu set Bentuk loceng Uniform-shaped
Seragam
data, gunakan rumus:
Largest Smallest Nilai data Nilai data 11. The shape of distribution is skewed if one of the tails
–
data value data value terbesar – terkecil of the histogram is longer than the other tail.
/
Number of classes Bilangan kelas Bentuk taburan ialah pencong jika satu daripada hujung histogram
adalah lebih panjang daripada hujungnya yang lain.
8. For a grouped data in uniform class intervals, the size of
class interval can be calculated.
Bagi data terkumpul dalam selang kelas yang seragam, saiz selang
kelas boleh dihitung.
(i) The difference between the lower limits or the upper
limits of two consecutive classes.
Beza antara had bawah atau had atas bagi dua kelas yang 0 Right-skewed 0 Left-skewed
berturutan.
Pencong ke kanan Pencong ke kiri
1 © Penerbitan Pelangi Sdn. Bhd.