
Page 40 - Ranger SPM 2022 Biology
P. 40
Biology SPM SPM Model Paper
32. Which statement is true about 35. Which food chain loses the most
fertilisation in flowering plant? amount of energy?
A Fertilisation occurs as soon as a A Maize → cattle → human
pollen grain is matured B Soy bean → human
B Fertilisation produces genetically C Grass → goat → human
Penerbitan Pelangi Sdn Bhd. All Rights Reserved.
identical plants D Phytoplankton → crustacean larva
C Fertilisation in plants produce → small fish → tuna fish → human
diploid zygote and triploid nucleus
D Fertilisation occurs between a 36. A pupil made a 1 m × 1 m quadrat to
male gamete and two female study the density of Mimosa pudica in
gametes a school field. Based on 5 quadrats,
the results were obtained and recorded
33. Which are the most likely adaptive as shown in Table 1
features of a plant growing in habitat
with high concentration of salt? Quadrat 1 2 3 4 5
I Thorny leaves Number
II Have stomata which removes of
excess water Mimosa 2 3 4 6 5
III Have special structures which pudica
secrete salt
IV Dropping off of old leaves that Table 1
store salt What is the density of Mimosa pudica
A I and II C II and III in the school field?
B I and III D III and IV A 2 m –2 C 4 m –2
–2
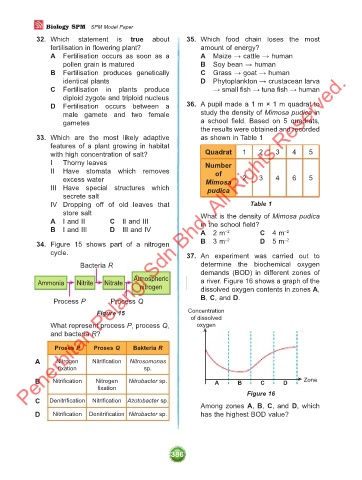
34. Figure 15 shows part of a nitrogen B 3 m D 5 m –2
cycle. 37. An experiment was carried out to
Bacteria R determine the biochemical oxygen
demands (BOD) in different zones of
Atmospheric
Ammonia Nitrite Nitrate a river. Figure 16 shows a graph of the
nitrogen dissolved oxygen contents in zones A,
B, C, and D.
Process P Process Q
Figure 15 Concentration
of dissolved
What represent process P, process Q, oxygen
and bacteria R?
Proses P Proses Q Bakteria R
A Nitrogen Nitrification Nitrosomonas
fixation sp.
B Nitrification Nitrogen Nitrobacter sp. A B C D Zone
fixation
Figure 16
C Denitrification Nitrification Azotobacter sp.
Among zones A, B, C, and D, which
D Nitrification Denitrification Nitrobacter sp. has the highest BOD value?
386
Model Paper.indd 386 3/29/22 5:22 PM