
Page 10 - The Effect of Hydrogen and Hydrides - ebook first test
P. 10
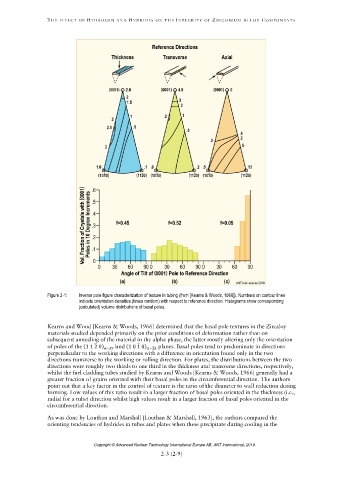
Figure 2-1: Inverse pole figure characterization of texture in tubing (from [Kearns & Woods, 1966]). Numbers on contour lines
indicate orientation densities (times random) with respect to reference direction. Histograms show corresponding
(calculated) volume distributions of basal poles.
(1 1 2 ̅ 0) α− (1 0 1 ̅ 0) α−Zr
Copyright © Advanced Nuclear Technology International Europe AB, ANT International, 2019.