
Page 12 - The Effect of Hydrogen and Hydrides - ebook first test
P. 12
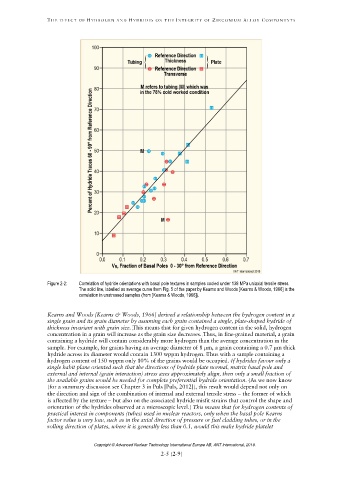
Figure 2-2: Correlation of hydride orientations with basal pole textures in samples cooled under 138 MPa uniaxial tensile stress.
The solid line, labelled as average curve from Fig. 5 of the paper by Kearns and Woods [Kearns & Woods, 1966] is the
correlation in unstressed samples (from [Kearns & Woods, 1966]).
Copyright © Advanced Nuclear Technology International Europe AB, ANT International, 2019.