
Page 136 - The Effect of Hydrogen and Hydrides - ebook first test
P. 136
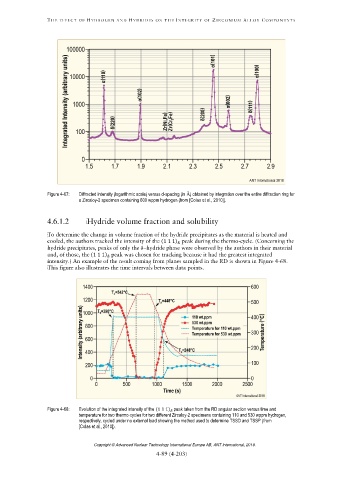
Figure 4-67: Diffracted intensity (logarithmic scale) versus d-spacing (in Å) obtained by integration over the entire diffraction ring for
a Zircaloy-2 specimen containing 600 wppm hydrogen (from [Colas et al., 2010]).
4.6.1.2
(1 1 1) δ
δ
(1 1 1) δ
Figure 4-68: Evolution of the integrated intensity of the (1 1 1) peak taken from the RD angular section versus time and
δ
temperature for two thermo-cycles for two different Zircaloy-2 specimens containing 110 and 530 wppm hydrogen,
respectively, cycled under no external load showing the method used to determine TSSD and TSSP (from
[Colas et al., 2010]).
Copyright © Advanced Nuclear Technology International Europe AB, ANT International, 2019.