Page 139 - The Effect of Hydrogen and Hydrides - ebook first test
P. 139

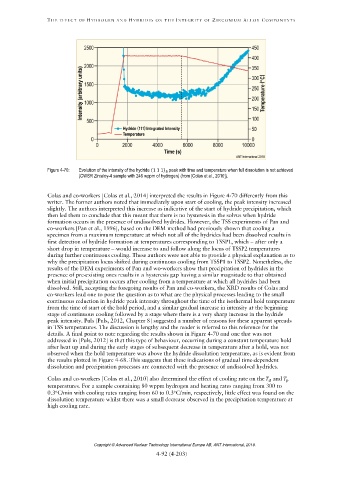
Figure 4-70:   Evolution of the intensity of the hydride (1 1 1)  peak with time and temperature when full dissolution is not achieved
                                                            δ
                             (CWSR Zircaloy-4 sample with 246 wppm of hydrogen) (from [Colas et al., 2010]).


                                                                                           
                                         


                                                              


                                   Copyright © Advanced Nuclear Technology International Europe AB, ANT International, 2019.
   134   135   136   137   138   139   140   141   142   143   144