
Page 49 - The Effect of Hydrogen and Hydrides - ebook first test
P. 49
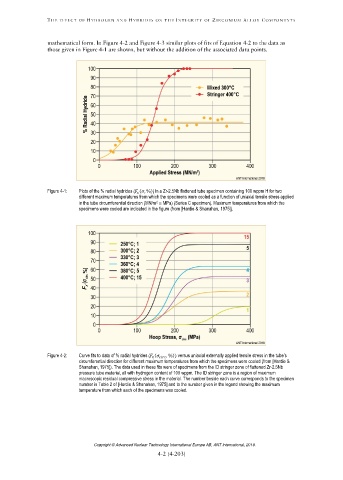
Figure 4-1: Plots of the % radial hydrides ( ( , %)) in a Zr-2.5Nb flattened tube specimen containing 100 wppm H for two
different maximum temperatures from which the specimens were cooled as a function of uniaxial tensile stress applied
2
in the tube circumferential direction (MN/m MPa) (Series C specimen). Maximum temperatures from which the
specimens were cooled are indicated in the figure (from [Hardie & Shanahan, 1975]).
Figure 4-2: Curve fits to data of % radial hydrides ( ( , %)) versus uniaxial externally applied tensile stress in the tube’s
circumferential direction for different maximum temperatures from which the specimens were cooled (from [Hardie &
Shanahan, 1975]). The data used in these fits were of specimens from the ID stringer zone of flattened Zr-2.5Nb
pressure tube material, all with hydrogen content of 100 wppm. The ID stringer zone is a region of maximum
macroscopic residual compressive stress in the material. The number beside each curve corresponds to the specimen
number in Table 2 of [Hardie & Shanahan, 1975] and to the number given in the legend showing the maximum
temperature from which each of the specimens was cooled.
Copyright © Advanced Nuclear Technology International Europe AB, ANT International, 2019.