
Page 54 - The Effect of Hydrogen and Hydrides - ebook first test
P. 54
⁄
1 (0)
( )
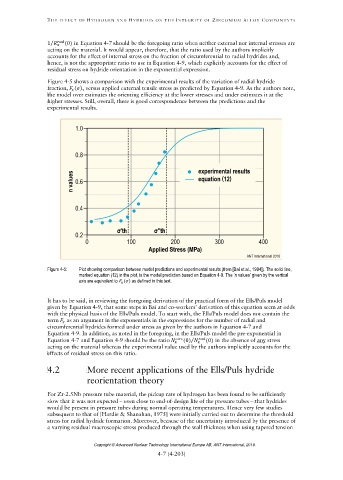
Figure 4-5: Plot showing comparison between model predictions and experimental results (from [Bai et al., 1994]). The solid line,
marked equation (12) in the plot, is the model prediction based on Equation 4-9. The ‘n values’ given by the vertical
axis are equivalent to ( ) as defined in this text.
⁄
(0) (0)
Copyright © Advanced Nuclear Technology International Europe AB, ANT International, 2019.