
Page 99 - The Effect of Hydrogen and Hydrides - ebook first test
P. 99
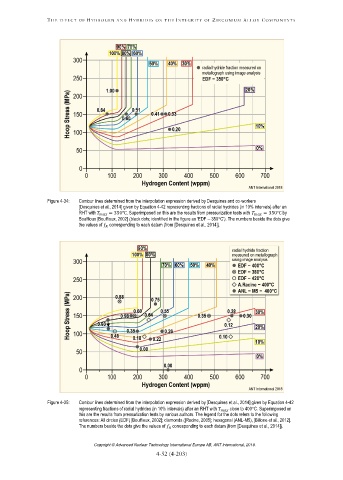
Figure 4-34: Contour lines determined from the interpolation expression derived by Desquines and co-workers
[Desquines et al., 2014] given by Equation 4-42 representing fractions of radial hydrides (in 10% intervals) after an
RHT with = 350℃. Superimposed on this are the results from pressurization tests with = 350℃ by
Bouffioux [Bouffioux, 2002] (black dots; identified in the figure as ‘EDF 350C’). The numbers beside the dots give
the values of corresponding to each datum (from [Desquines et al., 2014]).
Figure 4-35: Contour lines determined from the interpolation expression derived by [Desquines et al., 2014] given by Equation 4-42
representing fractions of radial hydrides (in 10% intervals) after an RHT with close to 400C. Superimposed on
this are the results from pressurization tests by various authors. The legend for the dots refers to the following
references: All circles (EDF) [Bouffioux, 2002]; diamonds ([Racine, 2005]; hexagonal (ANL-M5), [Billone et al., 2012].
The numbers beside the dots give the values of corresponding to each datum (from [Desquines et al., 2014]).
Copyright © Advanced Nuclear Technology International Europe AB, ANT International, 2019.