
Page 95 - The Effect of Hydrogen and Hydrides - ebook first test
P. 95
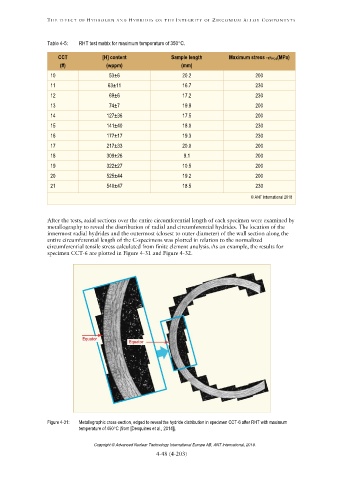
Table 4-5: RHT test matrix for maximum temperature of 350C.
CCT [H] content Sample length Maximum stress -,A(MPa)
(#) (wppm) (mm)
10 53±6 20.2 200
11 63±11 16.7 230
12 69±6 17.2 230
13 74±7 19.9 200
14 127±36 17.5 200
15 141±40 18.0 230
16 177±17 19.3 230
17 217±33 20.0 200
18 309±26 9.1 200
19 322±27 10.5 200
20 525±44 19.2 200
21 540±47 18.5 230
© ANT International 2018
Figure 4-31: Metallographic cross-section, edged to reveal the hydride distribution in specimen CCT-6 after RHT with maximum
temperature of 450C (from [Desquines et al., 2014]).
Copyright © Advanced Nuclear Technology International Europe AB, ANT International, 2019.