
Page 84 - Newmark Northwest 2021 Samples
P. 84
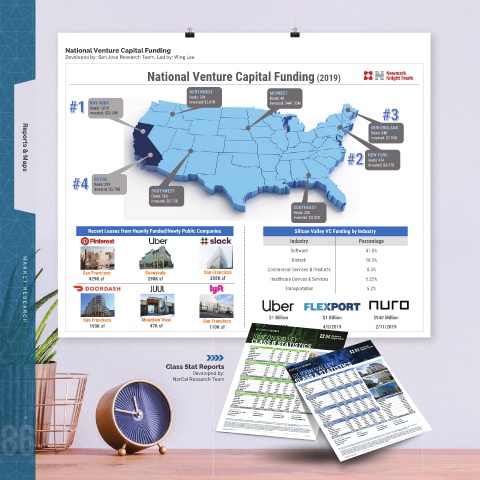
National Venture Capital Funding
Developed by: San Jose Research Team, Led by: Wing Lee
National Venture Capital Funding (2019)
NORTHWEST MIDWEST
Deals: 201 Deals: 48
BAY AREA Invested: $2.61B Invested: $447.35M
Deals: 1,016
Invested: $32.20B
NEW ENGLAND
Deals: 348
Invested: $7.04B
NEW YORK
Deals: 454
Invested: $9.47B
Reports & Maps
SO CAL
Deals: 329
Invested: $5.79B SOUTHWEST
Deals: 266
Invested: $3.17B
SOUTHEAST
Deals: 256
Invested: $3.02B
Recent Leases from Heavily Funded/Newly Public Companies Silicon Valley VC Funding by Industry
Industry Percentage
Software 41.5%
Biotech 10.5%
Commercial Services & Products 8.5%
San Francisco Sunnyvale San Francisco
429K sf 290K sf 208K sf Healthcare Devices & Services 5.25%
Transportation 5.2%
San Francisco Mountain View San Francisco $1 Billion $1 Billion $940 Million
193K sf 47K sf 110K sf 4/8/2019 4/5/2019 2/11/2019
MARKET RESEARCH
RESEARCH 1Q 2019
Created by San Jose Market Research - Newmark Knight Frank Information
Contained herein has been given to us by sources we deem reliable. We have no reason to doubt its accuracy, but make no guarantee, warranty or representation about it.
SILICON VALLEY
CLASS B STATISTICS
VACANCY RATE
Mountain View 1Q18
Sunnyvale 5.3% 2Q18 3Q18
Santa Clara 7.6% 7.7% 7.4% 4Q18 1Q19
N San Jose / Trimble S 17.8% 20.8% 6.7% 8.4% 6.7% 4.8% 5.7%
Downtown San Jose 11.2% 12.8% 21.5% 21.8% 5.6%
San Jose Airport 14.6% 14.7% 13.4% 12.4% 21.0%
West Valley 2.2% 15.1% 13.7% 11.3%
SILICON VALLEY 8.2% 2.8% 3.6% 4.1% 12.2%
11.19% 8.9% 9.8% 4.0%
ASKING RATE ($/SF) 1Q18 12.40% 12.98% 12.1% 9.3% 8.0%
RESEARCH 1Q 2019
Mountain
Mountain
Class S ta t Reports N N Santa Jose Clara / / View $3.55 $6.80 $3.62 2Q18 $3.30 3Q18 $3.80 SILICON VALLEY 1Q19
Class Stat Reports
View
11.2%
Sunnyvale
$6.80
Sunnyvale
4Q18
$6.43
$6.43
Santa
$5.91
$5.91
1Q19
$3.70
$3.70
Clara
$3.62
$5.80
$5.80
San
$6.33
$6.33
San
$3.30
Jose
$3.55
$4.30
$3.26
Trimble
Trimble
$4.30
$3.82
$3.82
$3.25
$2.96
$2.96
Developed by:
Developed by: West San San Downtown Airport Jose S S $3.24 $3.34 $3.26 $3.40 $3.25 $3.26 1Q19 CLASS A STATISTICS 4.6% 1.7% 19.2%
Downtown
San
San
4Q18
$3.11
$3.11
$3.26
$3.26
Jose
$3.26
$3.26
$3.22
$3.22
Airport
$3.24
3.1%
Jose
Jose
3Q18
$3.34
$3.26
$3.43
West
$3.43
$2.81
$3.40
Valley
$2.81
$3.59
$3.59
$2.75
$2.75
$3.54
SILICON Valley VALLEY $3.58 $3.72 $2.88 $2.87 $3.54 2Q18 5.5% 2.4% 19.3% 19.8% 11.2%
SILICON
$2.88
$3.58
$2.87
$3.72
VALLEY
$3.03
NorCal Research Team
NorCal Research Team Mountain View 1Q18 2Q18 $3.56 $3.59 $3.65 $3.03 1Q18 4.9% 6.3% 2.8% 4.1% 20.4% 24.2% 19.6% 9.3% 13.8% 14.9% 6.1%
$3.74
$3.74
$3.59
$3.59
$3.80
$3.59
NET ABSORPTION (SF)
NET ABSORPTION (SF)
$3.59
$3.81
$3.81
$3.56
$3.59
1Q18
Mountain View
2Q18
$3.65
3Q18
12,753
3Q18
Sunnyvale
Sunnyvale
12,753
4Q18
-69,018
-11,700
Santa Clara
-11,546
Santa Clara -11,700 -69,018 -11,546 4Q18 1Q19 5.5% 24.5% 19.2% 22.1% 16.4% 20.6% 6.2% 10.2% 1Q19
50,253
-7,209
-7,209
-18,051
-21,862
-73,609
N San Jose / Trimble S -73,609 -188,954 -21,862 50,253 -18,051 VACANCY RATE 28.3% 17.2% 22.7% 6.5% 10.0% 4Q18 $8.07
9,297
9,297
N San Jose / Trimble S
-188,954
-17,208
12,410
16,056
Downtown San Jose 16,056 -17,208 12,410 Mountain View 15.5% 12.59% $6.96
-20,222
Downtown San Jose
-48,384 -20,222 9.6% $8.75
-48,384
2,169
26,864
N San Jose / Trimble S
San Jose Airport -2,008 2,169 26,864 Sunnyvale 26.8% 12.54% 3Q18 $6.24 $4.20
-2,008
15,573
-7,517 15,573 $4.25
15,417
-10,360
Downtown San Jose
West Valley 4,161 -7,517 -10,360 87,555 15,417 Santa Clara 7.1% 2Q18 $6.85 $4.18 $4.66
87,555
INVENTORY (SF)
101,427
SILICON VALLEY -53,782 -5,136 -3,889 -4,587 101,427 INVENTORY (SF) 14.70% $6.22 $6.27 $4.14 $3.43
Mountain View
-108,129 -32,591 -46,711 860 Mountain View 1Q18 $6.24 $4.42 $4.43 $4.99
Sunnyvale
2,275,420
GROSS ABSORPTION (SF) -358,809 7,389 Sunnyvale San Jose Airport 2,275,420 $7.10 $4.09 $3.43
SILICON VALLEY
Mountain View 1Q18 -109,407 145,258 36,704 Santa Clara West Valley 1,093,231 $5.96 $4.34 $4.23 $4.63 $4.56 6,157,061
Santa Clara
1,093,231
Sunnyvale 59,867 2Q18 3Q18 175,631 N San Jose / Trimble S ASKING RATE ($/SF) 3,635,372 $4.42 $4.02 $4.17 $3.53 $4.45 1Q19 15,915,174
3,635,372
4Q18
N San Jose / Trimble S
Santa Clara 25,172 53,069 58,359 77,775 1Q19 Downtown San Jose View 2,040,131 $4.22 $3.69 $4.65 4Q18 113,193 11,891,555
11,037
Downtown San Jose
2,040,131
Sunnyvale
4,825,594
N San Jose / Trimble S 90,485 195,744 24,674 26,507 68,897 San Jose Airport Mountain 4,092,040 $4.14 $4.73 $4.51 3Q18 379,623 71,794 -5,018 INVENTORY (SF) 8,038,893
4,092,040
San Jose Airport
Trimble
West Valley
876,236
Downtown San Jose 85,564 53,817 103,592 45,202 15,393 West Valley Clara 876,236 S $3.58 $4.73 $4.43 51,896 685,566 -12,797 Mountain View 3,913,575
N San Jose / Trimble S
San
4,528,996
San Jose Airport 119,437 50,364 79,755 Campbell Santa Jose / Jose 2Q18 253,465 -133,295 Sunnyvale
Campbell
1,063,275
West Valley 15,819 73,867 174,782 57,995 37,960 Cupertino N San Downtown 4,528,996 $4.52 -128,138 15,136 373,589 -66,961 Santa Clara 9,707,976
963,604
963,604
Cupertino
-167,118
Jose
13,837
255,129
10,334
801,336
Los Gatos
SILICON VALLEY 40,753 120,834 11,457 157,904 267,713 Los Gatos 801,336 Airport 1Q18 25,016 925,062 174,676 44,065 -7,099 Downtown San Jose 6,254,506
437,097 100,198 18,056 Saratoga San Valley VALLEY 394,090 41,950 -40,183 San Jose Airport 870,231
884,607
SILICON
SAN JOSE OFFICE 522,205 523,426 71,281 115,260 Saratoga West 884,607 1,043,405 546,530 494,803 349,521 -21,961 1Q19 West Valley 100,529
West San Jose
West San Jose
212,052
212,052
119,129
3055 Olin Avenue, Suite 2200 WING LEE 446,998 603,034 SILICON VALLEY 1,667,397 NET ABSORPTION (SF) -793,655 -79,326 309,826 1,969,476 4Q18 326,538 Campbell 1,419,435
1,667,397
SILICON VALLEY
San Jose, CA 95128 Research Manager CONOR BOONE 18,541,426 Mountain View -93,341 775,887 348,429 Cupertino 60,099,324
1,442,631
1,164,627
408.987.4154 MICKEY MORAN 18,541,426 Sunnyvale 157,491 -282,989 3Q18 526,212 100,703 Los Gatos
N San Jose / Trimble S
wclee@ngkf.com cboone@ngkf.com mickey.moran@ngkf.com Santa Clara San Jose Airport -84,428 1Q18 114,866 1,316,858 306,602 2Q18 566,136 758,291 823,705 32,990 65,443 694,894 21,707 278,033 659,536 505,159 448,831 376,664 368,525 110,158 147,864 118,457 252,321 Saratoga MICKEY MORAN
West San Jose
Sr Research Analyst
109,369
Downtown San Jose
801,018
314,061
SILICON VALLEY
86 © NEWMARK KNIGHT FRANK | 2018 RESEARCH | 2 Mountain View San Jose Airport 408.987.4154 constitutes the statements and representations only of the source thereof, and not of NKF. Any recipient of this publication should independently verify such information and all other information that RESEARCH | 1
Research Analyst
139,775
991,166
mickey.moran@ngkf.com
Research Analyst
1,403,681
West Valley
SILICON VALLEY
GROSS ABSORPTION (SF)
1,757,556
3,134,792
Newmark Knight Frank has implemented a proprietary database and our tracking methodology has been revised. With this expansion and refinement in our data, there may be adjustments in
CONOR BOONE
465,109
Sr Research Analyst
2,538,833
Newmark Knight Frank has implemented a proprietary database and our tracking methodology has been revised. With this expansion and refinement in our data, there may be adjustments in
historical statistics including availability, asking rents, absorption and effective rents. Newmark Knight Frank Research Reports are available at www.ngkf.com/research
256,671
Newmark Knight Frank has implemented a proprietary database and our tracking methodology has been revised. With this expansion and refinement in our data, there may be adjustments in
All information contained in this publication is derived from sources that are deemed to be reliable. However, Newmark Knight Frank (NKF) has not verified any such information, and the same
55,126
Sunnyvale
historical statistics including availability, asking rents, absorption and effective rents. Newmark Knight Frank Research Reports are available at www.ngkf.com/research
cboone@ngkf.com
may be material to any decision that recipient may make in response to this publication, and should consult with professionals of the recipient’s choice with regard to all aspects of that decision,
3,692,523
442,924
N San Jose / Trimble S
including its legal, financial, and tax aspects and implications. Any recipient of this publication may not, without the prior written approval of NGKF, distribute, disseminate, publish, transmit, copy,
Santa Clara
60,099
All information contained in this publication is derived from sources that are deemed to be reliable. However, Newmark Knight Frank (NKF) has not verified any such information, and the same
Downtown San Jose
broadcast, upload, download, or in any other way reproduce this publication or any of the information it contains.
4,255,576
constitutes the statements and representations only of the source thereof, and not of NKF. Any recipient of this publication should independently verify such information and all other information that
constitutes the statements and representations only of the source thereof, and not of NKF. Any recipient of this publication should independently verify such information and all other information that
Research Manager
WING LEE
may be material to any decision that recipient may make in response to this publication, and should consult with professionals of the recipient’s choice with regard to all aspects of that decision,
including its legal, financial, and tax aspects and implications. Any recipient of this publication may not, without the prior written approval of NGKF, distribute, disseminate, publish, transmit, copy,
wclee@ngkf.com
West Valley
SILICON VALLEY
3055 Olin Avenue, Suite 2200
SAN JOSE OFFICE
broadcast, upload, download, or in any other way reproduce this publication or any of the information it contains.
San Jose, CA 95128
© NEWMARK KNIGHT FRANK | 2018