
Page 87 - Newmark Northwest 2021 Samples
P. 87
Regional O ce Market Reports
Developed by:
NorCal Research Team
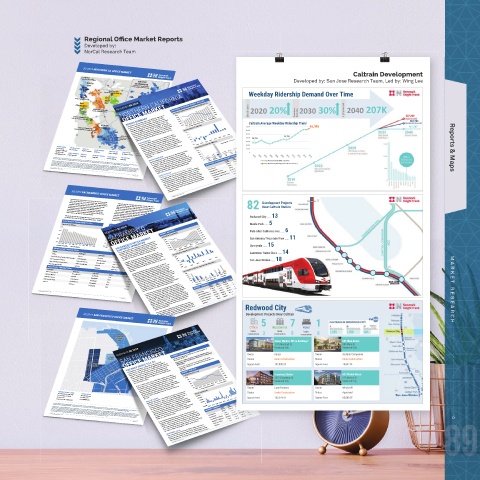
Caltrain Development
3Q 2019 NORTHERN CA OFFICE MARKET
↑ SONOMA
Novato-Santa Rosa-Petaluma Developed by: San Jose Research Team, Led by: Wing Lee
GREATER
NORTH SACRAMENTO
BAY Placer County-Sacramento County
Yolo County-El Dorado County
NORTH I-680 Weekday Ridership Demand Over Time
NORTHERN CALIFORNIA
Concord-Pleasant Hill-Walnut Creek
MARIN
Novato-San Rafael-Sausalito
EAST
SAN BAY
FRANCISCO RESEARCH 3Q 2019 NORTHERN CALIFORNIA MARKET ANALYSIS 14.0% 13.0%
TRI-VALLEY
GREATER OAKLAND San Ramon-Dublin-Pleasanton Full Service Asking Rent ($/SF) and Availability Rate (%) 12.0% 2020 20% 2030 30% High Speed Rail 2040 207K
Berkeley-Emeryville-Oakland OFFICE MARKET 11.0% 10.0% Electrification Downtown Extension
The Northern California office market posted 968,301 square feet of
NORTH PENINSULA $4.25 $3.95 3Q19 9.0% 207,200
consecutive quarter of positive absorption. Strong leasing activity,
Brisbane-San Mateo-San Carlos REGION SUMMARY $3.65 $3.35 3Q17 1Q18 3Q18 1Q19 Availability (%) 184,700
especially on quality, transit-oriented spaces, continues to push down
1Q17
total average asking rent increased $0.07 to $4.20/SF. In the largest
3Q16
direct lease deal of the quarter, 8x8 Inc. leased 177,815 square feet at
SILICON positive net absorption in the third quarter. This marks the eighth $3.05 $2.75 1Q16 Average Asking Rent (Price/SF) Caltrain Average Weekday Ridership Trend 65,095 161,200
South Bay Development’s Creekside Way project in Campbell. 8x8 will
SOUTH PENINSULA VALLEY the overall availability rate, which finished the quarter at 10.0%. The Net Absorption (SF, Millions) 70,000
whereupon occupation, 8x8 will be the largest employer in the city.
60,000
Redwood City-Palo Alto- Mountain View
Demand of 7.6 million square feet outpaced supply of 6.5 million
square feet, and the overall vacancy rate dropped to 2.8%. The city
SOUTH BAY relocate its San Jose HQ to the new Campbell space in early 2020, 5.0 3.5 2.0 1Q19 3Q19 50,000 34,120
SOUTH BAY
granted Prop M allocations to several developments during the
Sunnyvale-Santa Clara-West Valley
summer, but these projects are not expected to break ground until
Sunnyvale-Santa Clara-West Valley
Proposed
Milpitas-San Jose
Milpitas-San Jose SAN FRANCISCO 0.5 -1.0 1Q17 3Q17 1Q18 3Q18 Currently U/C Proposed 40,000 26,794
2020. Vacancy is expected to stay low, and supply and demand will
30,000
3Q16
1Q16
64.0
BONNIE READD KELLY DONG remain unbalanced until at least 2022. The restricted supply continues -2.5 Construction Pipeline (SF, Millions) 20,000
0.6 0.0
ANDREA ARATA Reports & Maps
VP, Research WENDI LIU 0.6 0.0 10,000
San Francisco to push asking rates, which increased 8.9% year-over-year to
Greater
Sacramento
Northern California MICKEY MORAN 0.0 0.3 0.3
South Peninsula $82.23/SF. Class A asking rates increased 10.5% year-over-year to 65.0 Greater
408.987.4197 South Bay KYLE PHILLIPS MAX GUNARI 52.0 1.7 4.4 Sacramento 0
the close of the prior quarter. On the sublease front, availability
CHRIS TERANISHI Greater Oakland 9.9 North North
breadd@ngkf.com WING LEE N I-680 & Tri-Valley KELLY DONG 8.3 Bay Bay
N I-680 & Tri-Valley
North Peninsula Sacramento 39.0 East Bay
Sacramento
availability. Tenant demand decreased 16.6% in the third quarter of
South Bay MILES WHITTEMORE Overall availability decreased this quarter to 9.4%, down from 9.7% at 26.0 3.3 8.7 1.4 Silicon Year Ago
2019 to 3.0 million square feet, with the bulk of the requirements now
North
South Bay JACOB MOLLOY $91.22/SF. IA MARKET SUMMARY
ERIC PARSONS Valley Period
378M SF
in the 10,000 to 20,000-square-foot-range. 405 East Fourth Avenue in
Quarter
Greater Oakland NORTH PENINSULA 13.0 Peninsula Prior Prior 378M SF
Quarter
Current
San
North Bay there may be adjustments in accounted for 2.4% of the total inventory and 33.3% of the total 0.0 NORTHERN CALIFORNIA MARKET SUMMARY 693K SF 11.3% 11.3% 1.8M SF $4.60/SF Avg. Weekday Ridership(AWR: until 2017)
Francisco
San Mateo completed construction this quarter, delivering 62,338-
380M SF
380M SF
Quarter
1.8M SF
10.8%
382M SF
10.8%
382M SF
Avg. Mid-Weekday Ridership(AWR: until 2017 and later )
$3.97/SF
$3.97/SF
693K SF
10.0%
10.0%
Newmark Knight Frank has implemented a proprietary database and our tracking methodology has been revised. With this expansion and refinement in our data, there may be adjustments in
historical statistics including availability, asking rents, absorption and effective rents. Newmark Knight Frank Research Reports are available at www.ngkf.com/research
$4.60/SF
$4.13/SF
968K SF
968K SF
$4.13/SF
The lengthy growth cycle has many concerned the market is nearing a
South Peninsula Availability & Asking Rents Tick Up
1.3M SF
$4.77/SF
All information contained in this publication is derived from sources that are deemed to be reliable. However, Newmark Knight Frank (NKF) has not verified any such information, and the same
downturn, yet gross absorption for the first three quarters of 2019 was
$4.20/SF
ch information, and the same
© NEWMARK KNIGHT FRANK | 2019
Availability Rate
Quarterly Net Absorption
formation and all other information
constitutes the statements and representations only of the source thereof, and not of NKF. Any recipient of this publication should independently verify such information and all other information
1.9M SF
transmit, copy, broadcast, upload, download, or in any other way reproduce this publication or any of the information it contains.
1.9M SF
$4.78/SF
that may be material to any decision that recipient may make in response to this publication, and should consult with professionals of the recipient’s choice with regard to all aspects of that
nearly 200,000 square feet greater than that for the same time last
Total Average FS Asking Rent
decision, including its legal, financial, and tax aspects and implications. Any recipient of this publication may not, without the prior written approval of NGKF, distribute, disseminate, publish,
SILICON VALLEY
year. One notable transaction was Softbank’s lease at Middle Plaza,
1.6M SF
1.6M SF
not only because of its size but also because it was pre-leased well in
advance of delivery, a sign of confidence that the region will remain
RESEARCH | 7 square-feet of pre-leased inventory to the downtown market. Total Inventory Total Class A Avg FS Asking Rent $4.20/SF $4.78/SF $4.77/SF 1.3M SF RESEARCH | 1
strong. Demand-driven opportunism will carry the market through the
Deliveries
end of the year, when patient tenants will be able to jump on quality
and viable options.
© NEWMARK KNIGHT FRANK | 2019
3Q 2019 SACRAMENTO OFFICE MARKET
82 Development Projects
Value-add plays 2868 Prospect Park Drive and 2882 Prospect Park
Drive sold for $152/SF and $179/SF, respectively, and attracted the
Near Caltrain Station
interest of investors from across the country. The growing number of
activity has been in a well-diversified number of fields, while both
companies with different investment criteria that are entering the
stabilized and investment capital continues to regard the region as a
market underscores how attractive Sacramento remains to
viable option for investment. Inventory remains low, which will give
institutional investors. With 400 Capitol Mall likely to trade in the
Redwood City …… 13
landlords confidence as they pull back on rental concessions, such
fourth quarter and 3000 and 3010 Lava Ridge Court and 980 9th
as free rent and TI allowances, which are now approaching levels not
Street hitting the market, Downtown and Roseville are proving to be
markets that are attractive to investment capital.
seen since before 2008. Both leasing and sales activity remain robust
and have continued to encourage landlords to raise asking rents,
which are still below historical peaks in most submarkets. Although
Overall, the third quarter continued the positive trends and reinforced
Menlo Park …… 5
the market is not likely to top its total absorption total for 2018, it has
the fundamentals of the Sacramento metropolitan market. Tenant
quarter on a strong note.
enough momentum to put up good numbers and finish out the fourth
AVAILABILITY BREAKDOWN BY TYPE
6.0 SACRAMENTO MARKET ANALYSIS 17.2%
Square Feet, Millions
16.0 AVAILABILITY BREAKDOWN BY CLASS
Square Feet, Millions
12.0 RESEARCH 3Q 2019 22.0% 19.6% Palo Alto/ California Ave …… 6
15.0
8.0 12.0 Asking Rent & Availability 14.8%
4.0 9.0 OFFICE MARKET $2.00 12.4% 10.0% San Antonio/ Mountain View …… 11
0.0 6.0 $1.90 3Q19
third quarter of 2019, which is typically the slowest quarter of the year.
3Q14 1Q15 3Q15 3.0 SACRAMENTO OFFICE MARKET 3Q18 Vacancy (%)
The office market posted 197,968 square feet of positive net absorption
1Q16
3Q16
1Q17 3Q17 $1.80 3Q17 Sunnyvale ……15
and brought the year-to-date total to a positive 621,605 square feet.
Sublease Availability 1Q18 3Q18 1Q19 3Q19 0.0 3Q17NUES MOMENTUM $1.70 3Q16
Direct Availability
3Q15 3Q15 1Q16 1Q16 3Q16 1Q17 The Sacramento office market maintained its positive momentum in the $1.60 Average Asking Rent ($/SF)
3Q15
3Q16
1Q17
Class C CONTI 3Q17 1Q18 1Q18 3Q18 3Q18 1Q19 1Q19 $1.50 3Q14
SELECT LEASE TRANSACTIONS
Class C
Tenant
Tenant Class B Class A 3Q19 3Q19 Net Absorption (Square Feet, Thousands) Lawrence/ Santa Clara …… 14
Building(s)
WeWork
WeWork Building(s) This marks the 12th consecutive quarter of positive net absorption for
Submarket the market. Its vacancy rate also dropped to 10.8% from 11.2%.
Submarket
660 J St
660 J St
Type
Downtown
State of CA Dept of Forestry & Fire Protection
on Downtown Type Downtown Sacramento led the quarter with 97,213 square feet of 900 3Q19 San Jose Diridon …… 18
Square Feet
Square Feet
710 Riverpoint
Direct Lease
NEC Corporation of America 710 Riverpoint Ct Ct Direct Lease positive net absorption. This was largely due to the 96,300-square-foot 600 3Q18
West Sacramento
96,300
West Sacramento WeWork lease signed at 660 J Street and the 23,380-square-foot lease 300
10850 Gold Center Dr 96,300 3Q17
Direct Lease
State of CA Dept of Social Services
State of CA Dept of Social Services er Dr Direct Lease with Delta Conveyance Design at 980 9th Street. 50 Corridor East also 0
50 Corridor East
The leading submarkets at the end of the third quarter of 2019 are
50 Corridor East
76,438
76,438
1640 E Roseville Pkwy
Delta Conveyance Design 1640 E Roseville Pkwy had a solid third quarter with 65,136 square feet of positive net 3Q16
Lease Renewal absorption, followed by Rocklin with 56,371 square feet of positive net
Lease Renewal
Roseville
Roseville -300 3Q15
980 9 th St St 35,071 Construction & Deliveries (Square Feet, Thousands)
35,071
Direct Lease
Direct Lease -600
SELECT SALE TRANSACTIONS 3Q14
Downtown
Downtown
26,000
Building(s) 26,000
Building(s)
Direct Lease Douglas Corridor of Roseville, Downtown and 50 Corridor East. To date,
Direct Lease
23,380
23,380
Submarket
2868 Prospect Park Dr Submarket absorption. the Douglas Corridor of Roseville has posted 300,131 square feet of
Sale Price positive net absorption, while Downtown has posted 225,305 square 2019
Sale Price
50 Corridor East 800
$/RSF
3001 Lava Ridge Ct or East $/RSF feet, which combined makes up approximately 85% of the overall 2018
3001 Lava Ridge Ct
$25,000,000 640 2017 Projected
$25,000,000
Roseville
Square Feet
Roseville Square Feet market’s positive net absorption year to date. Downtown Sacramento
2300 River Plaza Dr
2300 River Plaza Dr $152 and 50 Corridor continue to see a lot of tenant activity from the State of 480 2016
$152
12 Month
$24,900,000 2015
$24,900,000
Forecast
South Natomas 164,821 California and Sacramento County, as both entities continue to expand 320 12 Month
South Natomas
164,821
$230
2882 Prospect Park Dr $230 2014 Under Construction Forecast
$22,000,000 in the market. Roseville, though not a market that attracts much 2013
$22,000,000
1130 K St
108,348
1130 K St 50 Corridor East $275 108,348 government use, continues to do well with non-government related 160 0 2012 Year Ago
Period
$275
or East
$20,700,000 uses, healthcare and private entrepreneurs growing footprints or 2011 Prior
$20,700,000
80,000
Downtown 80,000 looking for space. Given the amount of tenant activity in the submarket, Deliveries Quarter 69.2M SF
dropped from 11.2% in second-quarter 2019 to 10.8%. The region has
Downtown
$179
not seen a rate this low since 2003. West Sacramento led the area with
$19,500,000 $179 MARKET SUMMARY Current 69.5M SF 12.6%
$19,500,000
115,593
$138 115,593 expect it to continue to do well in the fourth quarter of 2019. Quarter
$138
a 4.6% vacancy, followed by Folsom with a 5.8% vacancy (after posting
140,908
$1.97/SF
$1.97/SF
140,908 As noted above, the Sacramento metropolitan region’s vacancy rate Total Inventory 69.7M SF 10.8% 198K SF 11.2% 380K SF $2.00/SF 104K SF 345K SF MARKET RESEARCH
6.6% vacancy. Tenant activity continues to be strong. Other notable
leaders are South Natomas at 6.6%, Elk Grove/Laguna at 6.6% and the
$2.00/SF
345K SF
Douglas Corridor of Roseville at 7.6%. As vacancy continues to drop, the
© NEWMARK KNIGHT FRANK | 2018
$1.97/SF
643K SF
Quarterly Net Absorption
lack of inventory will be felt in most of the top-performing markets and
280K SF
643K SF
will remain an issue for the foreseeable future. Healthcare, insurance,
Total FS Asking Rent
housing, state and local government, engineering and technology
60K SF
Under Construction
RESEARCH | 2 44,386 of positive net absorption in the third quarter) and Rocklin with a Total Availability Rate $1.97/SF 643K SF 60K SF 643K SF 280K SF 0 0 RESEARCH | 1 Redwood City
Investment activity remained strong in the third quarter. Investors in
Deliveries
wood City
both the stabilized asset and value-add asset classes were very active.
Red
The stabilized properties 3001 Lava Ridge Court and 2300 River Plaza
Drive sold for $230/SF and $275/SF, indicating there is a lot of interest
continue to be market drivers.
in fully stabilized buildings in the Sacramento metro market.
r Ca
Development Projects Near Caltrain
r Ca
jects
ro
ent P
in
ltra
Nea
in
Develo
Develo
pm
pm
5 5
© NEWMARK KNIGHT FRANK | 2018
3Q 2019 SAN FRANCISCO OFFICE MARKET
Of fi ce ent P ro jects Nea ntial ltra 7 7 Hotel el 1 1
Hot
Residential
de
Resi
Office
d
nd
Un
U Under e r Under er Under
Un
er
d
s
ion
ion
r
u
ct
co
u
t
r
n
n
u
r
s
n
ion
co
construction 3 3 construction 5 5 co construction 0 0
t
ct
t
s
ct
5
Main Street
Kaiser Medical Office Building 2
88
Kais er M edi cal Off i ce B u i l di n g 2 885 Main Street
S
885 Main St
s
r
75
11 1175 Marshall St t 88 5 Ma in d Cit t y
Ma
S
all
h
SAN FRANCISCO CURRENT CONDITIONS 10.0% 8.0% 6.0% 4.0% Owner er Feet Kai der er 0 Const r u ct io n Ow q atu n ar er s e Feet A Acclaim Companies
Redwoo
Redwood City
Redwoo
d Cit
y
Redwood City
RESEARCH 3Q 2019
Overall vacancy dropped to 2.8%; Class A vacancy dropped 40
OFFICE MARKET
Demand of 7.6 million square feet outpaced availability of 6.5
million square feet; leasing volume continued to be constrained by
Owner
s
Ow
s
Compan
Kaiser
n
ie
cclaim
basis points to just 2.1%.
Class A rates increased 10.5% year over year to $91.22/SF.
ta
on
C
Status
der
tus
Un
Annual direct asking rates increased 8.9% in the same period to
St
Under Construction
t
r
s
o
n
u
cti
Under Construction
Status
S
Un
VACANCY DROPS TO 2.8%
At the end of the third quarter of 2019, the overall vacancy rate
dropped 40 basis points to 2.8%, and overall availability dropped 70
limited supply.
Square Feet
u
78
78,832 SF
S
S
2
197,800 SF
0 SF
F
Sq
Square Feet
u
,83
are
197,8
basis points to 7.8%, while demand of 7.6 million square feet outpaced
supply. Year-to-date leasing activity remained constrained, down 26.3%
compared with the same period last year. Despite the tight market,
MARKET ANALYSIS
$86.23/SF.
over half of which resulted from Dropbox’s move into 656,482 square
Asking Rent and Vacancy
y Stati
B
roadwa
al
W
n
t Street
u
0
61
Of the 3.3 million square feet currently under construction 84.0% has
been pre-leased or is rumored to be in leases. Although the city granted
S
u
t
Br
t
75
oadway
61
2075 Broadway St
20
0
Waln
610 Walnut St
Prop M allocations to several developments during the summer, these
feet at 1800 Owens Street.
3Q19
Redwoo
y
Redwood City
Redwood City
d Cit
d Cit
y
Redwoo
projects are not expected to break ground this year. As a result,
vacancy is expected to stay low, and supply and demand will remain
unbalanced until at least 2022 or 2023. The restricted supply continues
Average Asking Rent ($/SF)
to push asking rates, which increased 8.9% year-over-year to
3Q14
$82.23/SF. Class A asking rates increased 10.5% year-over-year to
n
Windy Hill
ers
Win
L
Lane Partners
Ow
n
3Q13
ane
t
dy H
Owner
il
l
Par
3Q12
d
S
ta
Approved
Status
A
ove
S
Status
pp
r
tus
Un
Const
der
Under Construction
ct
u
r
Despite the tight market, several landlords have noticed a slowdown in
NEWMARK KNIGHT FRANK
ANDREA ARATA more than 1.0 million square feet was absorbed during the quarter, $100 $80 $60 $40 $20 $0 Net Absorption (SF) 3Q15 3Q16 3Q17 3Q18 Vacancy (%) 2.0% 0.0% Ow ta n tus er Broadway Station on S io t n Owner er 610 Walnut Street
possible reason for this delay is that smaller tenants might hesitate at
One Bush Street, Suite 1500
e Feet
ar
u
65,080 SF
u
10
2,0
ar
e Feet
9 S
San Francisco, CA 94104 Research Director 1,600,000
7
S
q
q
S
the longer term lengths required and therefore seek alternatives
415.445.5155 3Q19 3Q19 Square Feet 102,079 SF F Square Feet 65 ,08 0 S F
SMALLER LEASES 800,000 400,000 -400,000 0 3Q11 3Q11 3Q12 3Q12 3Q13 3Q13 3Q14 3Q14 3Q15 3Q15 3Q16 3Q16 Prior Year Ago Period Period 82.8M SF 12 Month
elsewhere, whether in coworking spaces or nearby markets. Another
415.445.5133 $91.22/SF. 1,200,000 3Q18 3Q18
factor possibly affecting this size range is a change in venture funding
aarata@ngkf.com the time it takes to lease spaces of less than 20,000 square feet. One 3Q17 3Q17
Corporate CA RE #: 00832933
Forecast
Year Ago
investments in smaller companies. If tenants are concerned about rent
while the amount of funding has increased, resulting in fewer
82.8M SF
Quarter
liabilities on their balance sheets, shorter-term or less expensive
83.5M SF
Quarter
942K SF
83.3M SF
Recent headlines featuring large San Francisco tenants have many
historical statistics including availability, asking rents, absorption and effective rents. Newmark Knight Frank Research Reports are available at www.ngkf.com/research
Newmark Knight Frank has implemented a proprietary database and our tracking methodology has been revised. With this expansion and refinement in our data, there may be adjustments in
there may be adjustments in
328K SF
$79.16/SF
$79.16/SF
people speculating what the long-term result will be if a company puts
leases are a more favorable option.
Total Inventory
1.1M SF
4.3M SF
$84.89/SF
$84.89/SF
market has a lot of wiggle-room: if the amount of space that came back
ch information, and the same over the past few years: the total number of investments has dropped, MARKET SUMMARY Current 83.3M SF 2.9% 2.9% 1.1M SF $86.23/SF Quarter 83.5M SF 3.2% 3.2% 328K SF 3.3M SF 3.9% 3.9% 942K SF 4.3M SF 300K SF RESEARCH | 1
All information contained in this publication is derived from sources that are deemed to be reliable. However, Newmark Knight Frank (NKF) has not verified any such information, and the same
© NEWMARK KNIGHT FRANK | 2019
constitutes the statements and representations only of the source thereof, and not of NKF. Any recipient of this publication should independently verify such information and all other information
Vacancy Rate
formation and all other information
300K SF
Quarterly Net Absorption
transmit, copy, broadcast, upload, download, or in any other way reproduce this publication or any of the information it contains.
3.3M SF
$86.23/SF
that may be material to any decision that recipient may make in response to this publication, and should consult with professionals of the recipient’s choice with regard to all aspects of that
RESEARCH | 1
on the market during the eight quarters of recession were to come
back on the market right now, it would result in a 6.7% vacancy. Overall,
736K SF
decision, including its legal, financial, and tax aspects and implications. Any recipient of this publication may not, without the prior written approval of NGKF, distribute, disseminate, publish,
3.3M SF
this market is fairly insulated against a wobble in the economy.
Under Construction
RESEARCH | 4 significant space back on the market. However, with 2.8% vacancy, this Average FS Asking Rent 3.3M SF 0 SF 0 SF 736K SF
Jamestown purchased Levi’s Plaza for $826.0 million from Gerson
Deliveries
Bakar in one of the largest office deals in San Francisco history. The
building portfolio includes an office footprint of five buildings totaling
931,160 square feet. The largest tenant, Levi Strauss & Co, has a lease
INVESTMENT SALES 89
© NEWMARK KNIGHT FRANK | 2019