Page 105 - How to Make Money in Stocks Trilogy
P. 105

America’s Greatest Stock-Picking Secrets  49
                                                               140,000
                                                             300,000
                                                            640,000
                                                                   20,000
                                                                 60,000
                                                          Volume
          Price
                                             3.2
                                         4.5
                                           3.8
                                                     1.7
                                                       1.5
                                                   2.0
                                               2.8
                                                 2.4
                        16
                      19
                    22
                              10
                            12
                          14
                30
               34
                  26
             40
                                     6
                                   7
                                 8
                                                         3/1
           S&P 500
              1969 bear market t
              r
              e
              6
              1
                                                         3/1
                  Sell: climax top
                  Sell: climax top
                  Sell: climax top
                                        k cup-with-handle
                                        e
                                        e
                                        n
                  m
                  c
                  Se
                                                        p
                                                        Volume up
                                        w
                                        p
                                                        e
                                        8-week cu
                                        k cu
                                                          Volume up
                  Market correction
                  Market correction
                               Buy
                  c
                               u
                                        8
                                                          m
                                            8-week base
                                            bas
                                    y
                                    Buy
                                            w
                  r
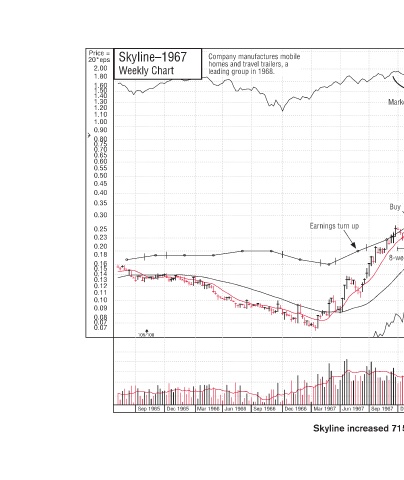
                                                                     Sep 1967  © 2009 Investor’s Business Daily, Inc.  Dec 1969 Sep 1969 Jun 1969 Mar 1969 Dec 1968 Sep 1968 Jun 1968 Mar 1968 Dec 1967 Skyline increased 715% in 98 weeks.
                                    B
                                       Earnings turn up  u  E        Jun 1967 Mar 1967 Dec 1966
           Company manufactures mobile   m  u homes and travel trailers, a  ,  v leading group in 1968.  1968  i i  Sep 1966 Jun 1966
            e
             di
                                                                     Mar 1966
             l
           Skyline–1967  Weekly Chart                    105/100     Dec 1965 Sep 1965
          Price =  20*eps   2.00     1.80    1.60   1.50      1.40   1.30      1.20     1.10    1.00     0.90     0.80   0.75      0.70   0.65   0.60        0.55    0.50     0.45     0.40     0.35     0.30     0.25    0.23    0.20    0.18    0.16    0.15    0.14    0.13    0.12    0.11    0.10    0.09    0.08    0.
   100   101   102   103   104   105   106   107   108   109   110