Page 107 - How to Make Money in Stocks Trilogy
P. 107

50
         A WINNING SYSTEM
                                                          Volume
                                                             80,000
                                                               40,000
                                                                  20,000
           Price
                                                  2.6
                                                     2.2
                                                 3.0
                                             4.0
                                               3.4
                                                       1.8
                           16
                         19
                             14
                                 10
                               12
            50
                 34
                   30
                     26
               40
                       22
                                        6
                                          5
                                    8
                                      7
                                            on
                                         , ,
                                            higher highs during market correctio
                                         Ascending base: pulled back 3 times
                                         m
                                          each time making higher lows and
                                          each time making higher lows and
                                          d
                                            e
                                             (also 2 pullbacks to the 10-week
                                             week
                                             e
                                            o
                                         3
                                          o
                                            t
                                             (also 2 pullbacks to the 10-
                                         c
                                                         2/1
                                         b
                                          r
                                            r
                                          g
                                             t
                                              moving average line)
                                              )
                                         p
                                          g
                                            d
                                             a
                                              a
                                         a
                                          a
                                            h
                                         g
                                              v
                                             l
                                            h
                                          m
                                              g
                                          h
                                            h
                                              v
                                             s
                                         c
           S&P 500
                                              m
                                            h
                                         A
                                             (
                                          e
                                                         4/3
                                     C
                                     C
                    Market correction
                        ven at this extended point
                        even at this extended point
                                      B
                                      B
                       Add: 3 weeks tight closes
                       s
                       Add: 3 weeks tight closes
                    t
                        i i
                        p
                                Buy
                       o
                                       A
                                u
                                       A
                                               week cup-
                                               week cup-
                                       A
                                       A
                                       A
                                       A
                    r
                                                th-handle
                                               u
                                                l
                    c
                        d
                        d
                       t
                                               13-we
                                               we
                                               13-w
                                               13-w
                                      Buy
                                      Buy
                                                with
                                                wit
                                                wit
                        h
                        h
                       w
                       A
                       A
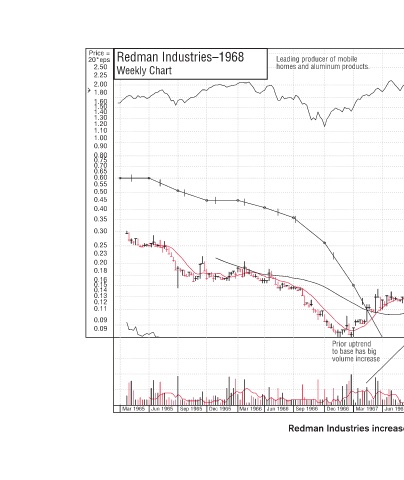
                                                                     Jun 1967 Sep 1969 Jun 1969 Mar 1969 Dec 1968 Sep 1968 Jun 1968 Mar 1968 Dec 1967 Sep 1967 Mar 1967  © 2009 Investor’s Business Daily, Inc.  Redman Industries increased 683% in 49 weeks.
                                                             e increase
                                                          end
           Leading producer of mobile  l  e  n homes and aluminum products. homes and aluminum products homes and aluminum products  d  m  s  Prior uptrend   pt  p  p  P io  to base has big   volume increase  volume  v  v  Dec 1966 Sep 1966
                                                                     Mar 1966 Jun 1966 Dec 1965
           Redman Industries–1968  Weekly Chart                      Sep 1965 Jun 1965
          Price =  20*eps   2.50   2.25    2.00   1.80    1.60   1.50   1.40   1.30    1.20    1.10    1.00    0.90    0.80   0.75    0.70    0.65    0.60    0.55    0.50    0.45    0.40    0.35    0.30    0.25    0.23    0.20    0.18    0.16    0.15    0.14    0.13    0.12    0.11    0.09    0.09   Mar 1965
   102   103   104   105   106   107   108   109   110   111   112