
Page 1051 - How to Make Money in Stocks Trilogy
P. 1051
38 HOW TO MAKE MONEY IN STOCKS—GETTING STARTED
Nasdaq Composite – 2003 Index
Daily Chart
1400
1350
1300
3/17/03 Follow-Through Day
Nasdaq rose 54% in next 10 months
© 2013 Investor’s Business Daily, Inc.
Volume (00)
8,000,000
4,000,000
2,000,000
3 17 31 14 28 14 28 11 25
January February March April
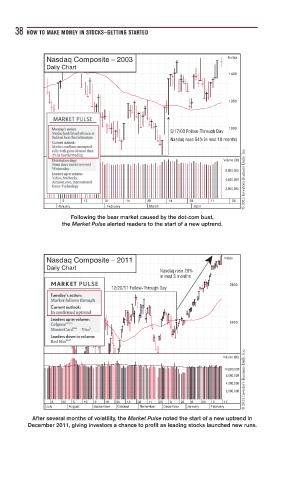
Following the bear market caused by the dot-com bust,
the Market Pulse alerted readers to the start of a new uptrend.
Nasdaq Composite – 2011 Index
Daily Chart
Nasdaq rose 20%
in next 3 months
2800
12/20/11 Follow-Through Day
2600
© 2013 Investor’s Business Daily, Inc.
Volume (00)
14,000,000
8,000,000
4,000,000
2,000,000
8 22 5 19 2 16 30 14 28 11 25 9 23 6 20 3 17
July August September October November December January February
After several months of volatility, the Market Pulse noted the start of a new uptrend in
December 2011, giving investors a chance to profit as leading stocks launched new runs.