
Page 1053 - How to Make Money in Stocks Trilogy
P. 1053
40 HOW TO MAKE MONEY IN STOCKS—GETTING STARTED
shaken to the point of near collapse. The Nasdaq had lost over half its value
since the start of the bear market in November 2007, and countless investors
had suffered similar losses. (Of course, anyone who followed the Selling
Checklist in this book would have avoided any serious damage. Hint, hint . . .)
So by March 2009, a lot of folks had taken a beating and were in no mood
to jump back into the stock market anytime soon. The doom and gloom
headlines only seemed to confirm those fears.
But for investors who understood how market cycles work, the signs of a
potential new uptrend were there—as were the tremendous money-making
opportunities that emerge at the beginning of every new bull market.
That brings up another important fact: New market uptrends tend to
begin when the economic and other news is bad.
That’s why the follow-through day is such a valuable tool: Instead of
wringing your hands at the latest headlines and trying to guess when the
market might turn around, just wait for a follow-through day, knowing that
new uptrends never begin without one.
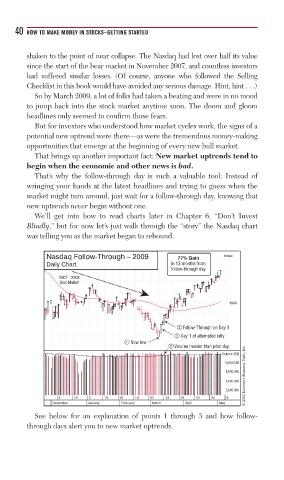
We’ll get into how to read charts later in Chapter 6, “Don’t Invest
Blindly,” but for now let’s just walk through the “story” the Nasdaq chart
was telling you as the market began to rebound.
Nasdaq Follow-Through – 2009 77% Gain Index
Daily Chart in 13 months from
follow-through day
2007 - 2008
Bear Market
1500
3 Follow-Through on Day 3
2 Day 1 of attempted rally
1 New low
3 Volume heavier than prior day
© 2013 Investor’s Business Daily, Inc.
Volume (00)
14,000,000
8,000,000
4,000,000
2,000,000
5 19 2 16 30 13 27 13 27 10 24 8
December January February March April May
See below for an explanation of points 1 through 3 and how follow-
through days alert you to new market uptrends.