Page 115 - How to Make Money in Stocks Trilogy
P. 115

54
         A WINNING SYSTEM
          Price
                         30
                       34
                     40
                           26
                               19
                                 16
                             22
                60
            80
              70
                  50
                                     12
                                   14
             S&P 500
                                 eek cup-
                                 -
                                 up-
                                  ith-handle
                                 kcu
                                  n
                                 eek c
                                 c
                                 8-week
                                  h
                                 e
                                 8-wee
                                 e
                                  with-
                                  with
                         uy
                         Buy
                                 -
                         u
                                     se
                                     base
                                     ase
                                     10-week bas
                                     bas
                                     week ba
                                     b
                                     b
                                     e
                              y
                              Buy
                              B
                                     10
                                     1
                                        Buy 10  B  8  7  6  9-week base  k b  9  4.5  3.8  Volume up Volume up  V  3.2  2.8  3/2  3/2  11/10  Volume  Volume up  o  80,000  40,000  20,000  Mar 1973 Dec 1972 Sep 1972 Jun 1972 Mar 1972 Dec 1971 Sep 1971 Jun 1971 Mar 1971 Dec 1970  © 2009 Investor’s Business Daily, Inc
                                                                     Sep 1970
                                                                     Jun 1970
                                                                     Mar 1970
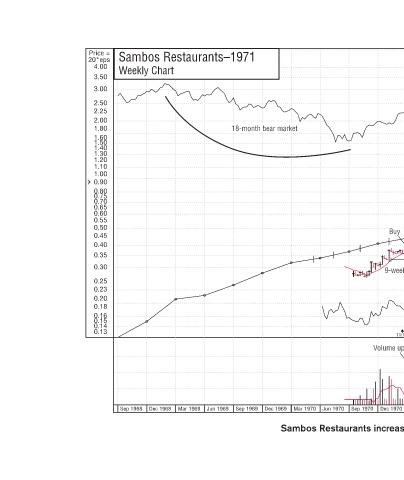
                       18-month bear market  1                       Dec 1969 Sep 1969
                       t  k
           Sambos Restaurants–1971   Weekly Chart                    Jun 1969 Mar 1969 Dec 1968
          Price =  20*eps   4.00    3.50     3.00     2.50    2.25    2.00     1.80    1.60    1.50    1.40    1.30    1.20    1.10    1.00     0.90    0.80   0.75      0.70    0.65    0.60     0.55    0.50    0.45    0.40    0.35    0.30    0.25    0.23    0.20    0.18    0.16    0.15    0.14    0.13   Sep 1968
   110   111   112   113   114   115   116   117   118   119   120