
Page 112 - How to Make Money in Stocks Trilogy
P. 112
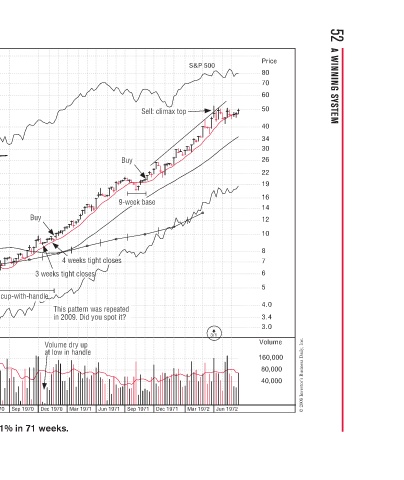
52  A WINNING SYSTEM


            Price  80  70  60  50  40  34  30  26  22  19  16  14  12  10  8  7  6  5  4.0  3.4  3.0  Volume  160,000  80,000  40,000  © 2009 Investor’s Business Daily, Inc.


                                                                     Jun 1972

            S&P 500  p                                   3/1         Mar 1972

                    Sell: climax top Sell: climax top  x  m  e       Dec 1971


                    S
                    S
                    S
                            Buy  Buy  B  ek base  9-week b  b  ek b  e  e  w  e  ?  Sep 1971
                                             oses  oses  s  lose  e  e  e  ot it?  Jun 1971
                                             4 weeks tight close 4 weeks tight clos  h  e  s 3 weeks tight closes 3 weeks tight closes  s  c ose  s  s  g  This pattern was repeated  a  n  t in 2009. Did you spot it? Did you spot  o  d  n 2009  0  p Volume dry up  y  e at low in handle  l  a  n  Mar 1971


                                                   46-week big cup-with-handle 46-week big cup-with-handle  p  Jun 1970 Rite Aid increased 421% in 71 weeks.
                                      Buy  Buy  3                    Sep 1970
                                      y        s  e  e  e  n  h  n  m  o  w  t  Dec 1970


                              07 t  tim  0  O  ry  0  h handle growth  n  e  46  Mar 1970 Dec 1969
                            18-month bear market similar in time to   i  il  im  t  k  m  th b  o 17-month major bear market from October 200  k  r  j  o through March 2009. Therefore, 2009 recovery  r  2  g could have several big cup-with-handle growth  with could have several big cup  p  r  h stocks like Rite Aid


                            18
                                                                     Sep 1968 Dec 1968
           Rite Aid–1970  Weekly Chart                               Jun 1968 Mar 1968


          Price =  20*eps   4.00     3.50    3.00    2.50     2.25     2.00    1.80     1.60    1.50    1.40   1.30   1.20        1.10     1.00    0.90     0.80    0.75    0.70    0.65    0.60    0.55    0.50    0.45    0.40    0.35    0.30    0.25    0.23    0.20    0.18    0.16    0.15