
Page 1153 - How to Make Money in Stocks Trilogy
P. 1153
138 HOW TO MAKE MONEY IN STOCKS—GETTING STARTED
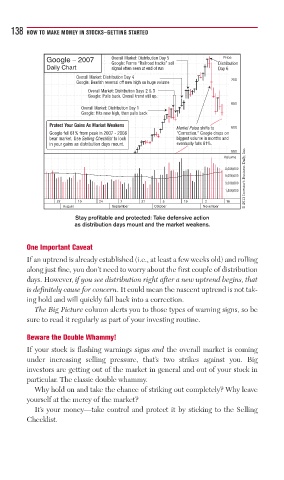
Google – 2007 Overall Market: Distribution Day 5 Price
Google: Forms “Railroad tracks” sell Distribution
Daily Chart signal often seen at end of run Day 6
Overall Market: Distribution Day 4
Google: Bearish reversal off new high on huge volume 700
Overall Market: Distribution Days 2 & 3
Google: Pulls back. Overall trend still up.
650
Overall Market: Distribution Day 1
Google: Hits new high, then pulls back
Protect Your Gains As Market Weakens Market Pulse shifts to 600
Google fell 61% from peak in 2007 - 2008 “Correction.” Google drops on
bear market. Use Selling Checklist to lock biggest volume in months and
in your gains as distribution days mount. eventually falls 61%.
© 2013 Investor’s Business Daily, Inc.
550
Volume
8,000,000
5,000,000
3,000,000
1,800,000
27 10 24 7 21 5 19 2 16
August September October November
Stay profitable and protected: Take defensive action
as distribution days mount and the market weakens.
One Important Caveat
If an uptrend is already established (i.e., at least a few weeks old) and rolling
along just fine, you don’t need to worry about the first couple of distribution
days. However, if you see distribution right after a new uptrend begins, that
is definitely cause for concern. It could mean the nascent uptrend is not tak-
ing hold and will quickly fall back into a correction.
The Big Picture column alerts you to those types of warning signs, so be
sure to read it regularly as part of your investing routine.
Beware the Double Whammy!
If your stock is flashing warnings signs and the overall market is coming
under increasing selling pressure, that’s two strikes against you. Big
investors are getting out of the market in general and out of your stock in
particular. The classic double whammy.
Why hold on and take the chance of striking out completely? Why leave
yourself at the mercy of the market?
It’s your money—take control and protect it by sticking to the Selling
Checklist.