
Page 149 - How to Make Money in Stocks Trilogy
P. 149
America’s Greatest Stock-Picking Secrets 71
560,000
920,000
200,000
340,000
Volume
Price
190
220
120
140
160
100
300
340
260
11
13
20
24
45
80
28
32
70
17
15
38
60
g
to 10-week moving
Add: 1st pullback
i
for 8 full weeks from
for 8 full weeks from
m
m
Stock up 20% in 3
weeks, must hold
add small amount
ld
buy and can now
w
n
u
u
k
t h
%
e
m
e
t
ot t
average
Do Not Buy! 3 weeks is no
Do Not Buy! 3 weeks is no
a base, sell on way up on
g
w
2
u
n
n
t10-
c
a
this 4th stage non-base
u
s
ve
m
d
u
p
,
b
k
Dry-up
p
S&P 500
e
u
y
d
o
y
e
g
high tight flag
high tight flag
a
n
Buy: possible
r
b
n
y
Buy
f
Buy
r
B
g
o
t
B
ek
s
h
ch
h
e
4th
y
Or you could decide to just hold another 8 or 10 weeks whic
correction of 20%, or stock’s first pullback to around 10-we
moving average line, which will be another buy opportunit ty.
which will be another buy opportunity
Holding for 1st 8 weeks got you through 1st pullback down
B
4
w
B
h
to 40 and now you’re ahead 58% rather than 20%. So due
So due
s
h
h
N
e
w
Buy
ge
ge
thi
to exceptional action, you can hold through stock’s first
s
s
1
h
d
g
ag
361,000. Huge volume increase of 317% above averag
0
Bu
0
D
(1.5 million shares) vs prior 2 weeks volume of 78,000
a
t
c
0
n
e
e
p
e
Average weekly volume when stock breaks out was
han 20%
%
o
e a
o
a
t w
7
l
c
o
abo
o
s
r
n
e
o
b
to 40 and now you re ahead 58% rather th
h
% a
8
1
ows means little selling
g
g
g
g
e
lows means little selling
g
k
c
k
could, by that time, create another base!
e
g
b
e
l
s
e
7
O
g
Volume dry-up along
o
IPO
O
v
r
k b
*
*
3
a
3
o
o
b
a
p
r
k
k
%
ease o
h
w
d
r
t t
u
t t
h
e
w
y
2
a
y
s
n
n
n
h
a
h
c
u
o
w
g
e
e
t
i
n
u
r
m
, y
w
e
e
s
s
o
k
m
s
u
r
r
moving average line
o u
V
l
uge
kl
d
o
n
o
r
e
u
p
,000
o
o
o
36
Av
6
r
o
o
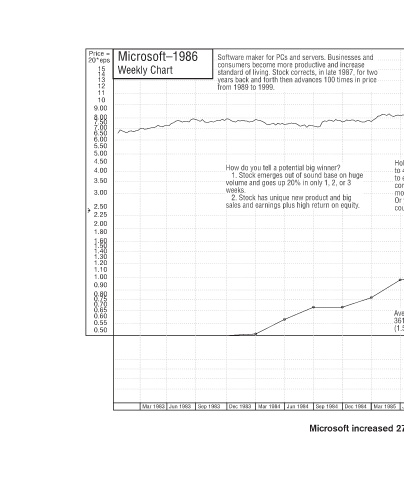
Mar 1985 Jun 1987 Mar 1987 Dec 1986 Sep 1986 Jun 1986 Mar 1986 Dec 1985 Sep 1985 Jun 1985 © 2009 Investor’s Business Daily, Inc. Microsoft increased 272% in 30 weeks.
Software maker for PCs and servers. Businesses and Sof ftware maker for PCs and servers. Businesses and v s k consumers become more productive and increase c o b standard of living. Stock corrects, in late 1987, for two t l i ts Stk c i f li i years back and forth then advances 100 times in
d n n tw f 1987 9 c m o or 3 o e Dec 1984
from 1989 to 1999.
weeks.
d
td
m
n
H
w
s
v
a
n
Sep 1983 Dec 1983
Microsoft–1986 Weekly Chart Jun 1983 Mar 1983
Price = 20*eps 15 14 13 12 11 10 9.00 8.00 7.50 7.00 6.50 6.00 5.50 5.00 4.50 4.00 3.50 3.00 2.50 2.25 2.00 1.80 1.60 1.50 1.40 1.30 1.20 1.10 1.00 0.90 0.80 0.75 0.70 0.65 0.60 0.55 0.50