
Page 151 - How to Make Money in Stocks Trilogy
P. 151
72
A WINNING SYSTEM
140,000
300,000
20,000
Volume
60,000
Price
3.8
3.2
4.5
19
40
34
16
10
50
22
80
26
14
12
60
30
70
6
8
7
adjusted for
adjusted for
All prices
2/1 split
ic
p
t
2/1
All p
u
A
p
Sell: climax top
a
2
S&P 500
x
to 10-week moving
to 10-week moving
lim
n
high
4-week high
high
h
h
gh
Add: 1st pullback
k
4week hig
c
o
llba
ag
h
g
tight flag
Sll
e
u
k
S
n
Volume up on
correction
o
Buy
1st
y
io
g
g
g
average
ge
w
-
Market
new high
gh
O
IPO
O
e
r
k
Add
d
*
o
m
o
h
M
a
A
o
e
nd
flag of 4 weeks. Note extreme volume dry-up as
s
g
stock. It is not obvious to everyone. That, along
New issue at 5.50 runs up to 9.63, then builds
little selling coming into stock. Little volume an
stock slowly creeps up closing tight with prior
weeks and tiny spread from each week’s high
then builds
to low. Stock is under slow accumulation with
a
h
to low. Stock is under slow accumulation with
weeks and tiny spread from each week s high
io
h
acceleration
d
o
ce the
slight move up means few people notice the
with strong fundamentals, is why it worked.
kd
d
w
u
h
m
i
h
-
ith p
Earnings
g
n
o
r
d
t
o
n
e
c
slight move up means few people notic
’
w
o
c
r
e
e
m
l
ht
t
y i
Newissue at550 runs up to 9 63
hy
y
h
ti i
o
o
L
6
l
u
k
c
e
e
in
e
e
, i
w
lo
w
p
ls
s
o
o
r
s
e
t
p
t
s
d
o
u
c
k
g f f
e
t
l
l
k
ih
g
g
o
t
to
e
e
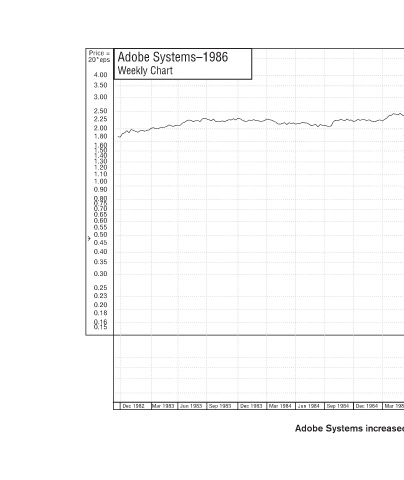
Mar 1985 Jun 1987 Mar 1987 Dec 1986 Sep 1986 Jun 1986 Mar 1986 Dec 1985 Sep 1985 Jun 1985 © 2009 Investor’s Business Daily, Inc. Adobe Systems increased 307% in 23 weeks.
Dec 1984
Sep 1984
Jun 1984
Mar 1984
Dec 1983 Sep 1983
Adobe Systems–1986 Weekly Chart Jun 1983 Mar 1983
Price = 20*eps 4.00 3.50 3.00 2.50 2.25 2.00 1.80 1.60 1.50 1.40 1.30 1.20 1.10 1.00 0.90 0.80 0.75 0.70 0.65 0.60 0.55 0.50 0.45 0.40 0.35 0.30 0.25 0.23 0.20 0.18 0.16 0.15 Dec 1982