
Page 182 - How to Make Money in Stocks Trilogy
P. 182
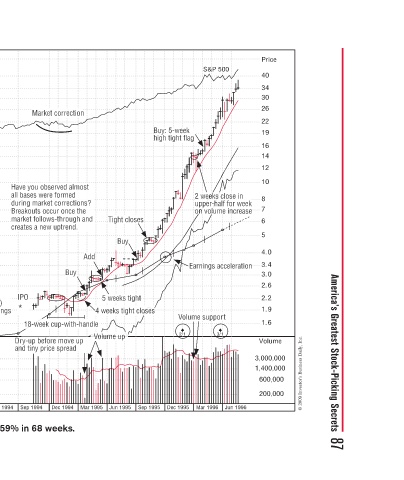
America’s Greatest Stock-Picking Secrets  87


           Price  40  34  30  26  22  19  16  14  12  10  8  k  7  e  e  6  5  4.0  3.4  n  n  3.0  2.6  2.2  1.9  1.6  Volume  3,000,000  1,400,000  600,000  200,000  © 2009 Investor’s Business Daily, Inc.


             S&P 500              s close in  s  c  eks  s  ek  e  2 wee  e  w  upper-half for week  o  per-h  -h  p  lume increase ume increase  n  e  n vol l  vol  on  on  n  Earnings acceleration Earnings acceleration  l  c  a  rt Volume support  p  s  m  3/1  Jun 1996 Mar 1996


                       Buy: 5-week   week  e  Buy: 5-  y  high tight flag   g  g  h  Vo  2/1  Dec 1995


                       B
                       B
                        h
                                                     oses  s  oses  ses  o  o  Sep 1995
                                      Tight closes Tight closes Tight closes  s  g  Buy  u  5weeks tight 5 weeks tight  h  s  4 weeks tight closes 4weeks tight clos  k  e  Volume up Volume up  p  Jun 1995
                                                   t t
                    n  o        m  s  o  t  through and  n  h  Add  A  Buy  Buy  4  handle  e  n  with-  Vo  V  V  V  V  u  Mar 1995
                    Market correction  e  o  e  Have you observed almost t  v  s  all bases were formed  m  o  r during market corrections?  e  o  e Breakouts occur once the Breakouts occur once the  n  r  c market follows-through and  o  t  w creates a new uptrend.  e  p  w  B  B  8-week cup-with-handle  w  p  wee
                                      market follows

                                                   IPO
                                                   IPO
                                       e
                                    e
                                      a
                                a
                                                   I
                                   u
                                                     s P  *  s  a  18-w  18-w  18  Dr  and tiny pric  Sep 1994 Jun 1994 Accustaff increased 1359% in 68 weeks.
                                                  Pay attention to Initial  t  y Public Offerings (IPOs)  f that show strong earnings that show strong earnings  w  Mar 1994 Dec 1993
                                                  i
                                                                     Sep 1993
                                                                     Jun 1993

                                                                     Mar 1993

                                                                     Dec 1992


                                                                     Sep 1992
           Accustaff–1995  Weekly Chart                              Jun 1992 Mar 1992


          Price =  20*eps   2.00     1.80   1.60    1.50    1.40    1.30   1.20   1.10   1.00    0.90    0.80    0.75   0.70    0.65    0.60    0.55   0.50   0.45    0.40   0.35    0.30    0.25    0.23    0.20    0.18    0.16    0.15    0.14    0.13    0.12    0.11    0.10    0.09    0.08    0.07