
Page 178 - How to Make Money in Stocks Trilogy
P. 178
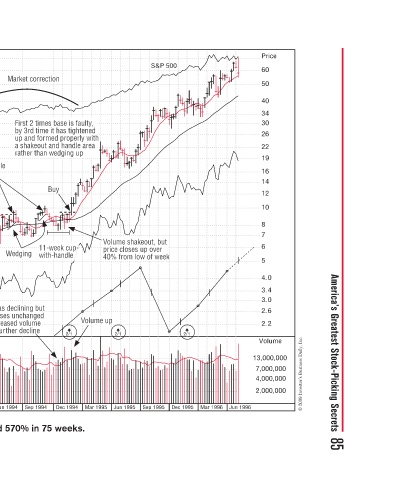
America’s Greatest Stock-Picking Secrets  85


           Price  60  50  40  34  30  26  22  19  16  14  12  10  8  7  6  5  4.0  3.4  3.0  2.6  2.2  Volume  13,000,000  7,000,000  4,000,000  2,000,000  © 2009 Investor’s Business Daily, Inc.

                                                                     Jun 1996

                                                                     Mar 1996

                                                         2/1         Dec 1995
            S&P 500                       b  u  e  k  k  w           Sep 1995
                                          Volume shakeout, but  k  s  m  price closes up over  u  s  l  c 40% from low of week  o  w  m  f  2/1  Jun 1995


                        h e  e  w  y  e  a  p  l  ic  %  Volume up  p  p  p  p  p  e  u  V  Mar 1995
                      y
                      u
              n  o    First 2 times base is faulty, First 2 times base is faulty  s  s  b by 3rd time it has tightened  g  i  a  t up and formed properly with  p  p  e a shakeout and handle area a shakeout and handle area  n  h  n rather than wedging up  g  g  w  Buy  u  week cup- 11-week cup-  u  k  w  e with-hand
              Market correction  ke  rs  y  s  t  11  Wedging  t  g  n  d  v  d  Sep 1994


                             dle o  o  o  n  W       Stock was declining bu  w price closes unchanged  c with increased volume with increased volume  n  and no further decline  o  Jun 1994

           e.  y  c  y  o  e  or  or  a  a  Do Not Buy! Chartistoo Do Not Buy! Chart is too  C wide and loose and hand  s  wedges up along lows wedges up along lows  o  Mar 1994 Dec 1993 America Online increased 570% in 75 weeks.
           Innovators drive each new stock market cycle  c  h  s Their new products, services, technology and  t  p inventions are bought by consumers who are  nventions are bought by consumers who are  h the true boss in a capitalist system as they   s  p  o freely choose to buy the products they want o freely cho


             n
            T
                 n
                  h
                                                                     Dec 1992 Mar 1993 Sep 1992
           America Online–1994  Weekly Chart          IPO  IPO  O  O  *  Jun 1992 Mar 1992


          Price =  20*eps   3.00     2.50    2.25     2.00    1.80    1.60    1.50   1.40      1.30     1.20     1.10    1.00    0.90    0.80    0.75   0.70   0.65         0.60     0.55     0.50     0.45    0.40    0.35    0.30    0.25    0.23    0.20    0.18    0.16    0.15    0.14    0.13    0.12    0.11