
Page 193 - How to Make Money in Stocks Trilogy
P. 193
America’s Greatest Stock-Picking Secrets 93
50,000,000
30,000,000
18,000,000
Volume
Price
125
104
0.9
4.2
2.4
1.1
1.4
2.0
1.6
2.9
3.5
13
15
28
10
86
72
34
23
49
41
18
60
5
6
7
9
ff 10-week
r
r
oving average
ht and in uppe
t and in uppe
ving average
OK closes
alf of spreads
K closes
2/1
o
1
pr
a
i
p
d: : off
Add: off
n
OK
Still OK
K
o
Still OK
n
mov
mov
ov
e
ne
line
t t
tight
tight
ht
e
e
breakout buy point, add
d
d
o
2/1
alf
half
lin
average line on volume
average line on volume
over 10-week moving
ing
n
t
u
when crosses back
,
Normal pullback to
Normal pullback to
ght close
ght close
o
eek mo
s
i
a
v
yp
p
Volume up
p
Volume up
s
o
c
u
k
b
y
Tight
ght
areas
: crosses over
dd: crosses over
m
b
n
u
w
s
e
e
Tig
g
g
10-week moving
week moving
ar
Buy
Buy
a
o
ge
0
10
u
2/1
a
i
c
average line
e
m
s
e
n
r
e
e
e
S&P 500
w
o
a
ge
e
r
w
Add:
Add:
r
Add
10
1
a
1
1
1
p
p
p
Volume up
e
22-week cup-with-handle
22-week cup-with-handle
p
p
Volume up
Volume up
n
e
n
lu
n
n
n
Market correction
-
Market correction
Buy
Buy
V
V
V
V
c
w
r
k
w
r
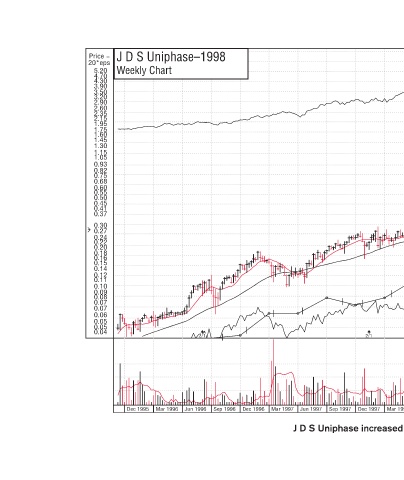
Mar 1998 Mar 2000 Dec 1999 Sep 1999 Jun 1999 Mar 1999 Dec 1998 Sep 1998 Jun 1998 © 2009 Investor’s Business Daily, Inc. J D S Uniphase increased 1946% in 66 weeks.
2/1 Dec 1997
Sep 1997
Jun 1997
Mar 1997
Dec 1996 Sep 1996
J D S Uniphase–1998 Weekly Chart 2/1 Jun 1996 Mar 1996 Dec 1995
Price = 20*eps 5.20 4.70 4.30 3.90 3.50 3.20 2.90 2.60 2.35 2.15 1.95 1.75 1.60 1.45 1.30 1.15 1.05 0.93 0.82 0.75 0.68 0.60 0.55 0.50 0.45 0.41 0.37 0.30 0.27 0.24 0.22 0.20 0.18 0.16 0.15 0.14 0.12 0.