
Page 195 - How to Make Money in Stocks Trilogy
P. 195
94
A WINNING SYSTEM
40,000,000
20,000,000
80,000,000
Volume
Price
155
135
114
180
4.2
19
54
16
22
84
98
72
41
47
14
30
35
62
26
12
10
5
4
7
9
6
4-week high
4-week high
g
ag
tight flag
g
Up off 10-week moving
g
week moving
average line on volume
e
average line on volume
a
k
k
u
e
t
o
m
v
4/1
i
4
4
p
p
Volume up
Volume up
Sell: climax top on
n
e
m
un-up
0-
up
p
p
p
p
li
i
0
Up off 10
Sell: climax to
Buy
C
C
S&P 500
4/1 split t t run
g
g
ff
e
Ascending base
Ascending base
e
e
B
B
x
4/1 split ru
V
u
Buy
Volume up
p
p
p
p o
B
B
m
)
(3 pullbacks)
e
ave
p
B
b
s
m
c
A
A
n
s
s
p
p
Volume up
n
4
V
S
4
(pu
e
s
2/1
u
Add
d
cup-with-handle
e
24-week cup-with-handle
handle
at t
l
they look like to guide you in
Are you now able to see wha
.
they look like to guide you in
leaders that had climax tops.
So far, you’ve seen 23 great
you ve seen 23 great
Buy
Buy
p
u
a
u
w
o
e
4th time: finally
y
y
with
h
x
e
a classic cup-
m
Market correction
n
n
w
with-handle
o
e
handle
o
u
week cup
102/100
ic
u
e
e
d
o
e
a
k c
c
e
h
with-
o
e
t
la
the future?
the future?
u
t
w
t
w
e
h
24
o
o
t
2
a
r
r
r
r
So far
r
in lower half of
mostofpattern
3. Do Not Buy!
most of pattern
in lower half of
3 bottoms and
y
N
o
o
e
base
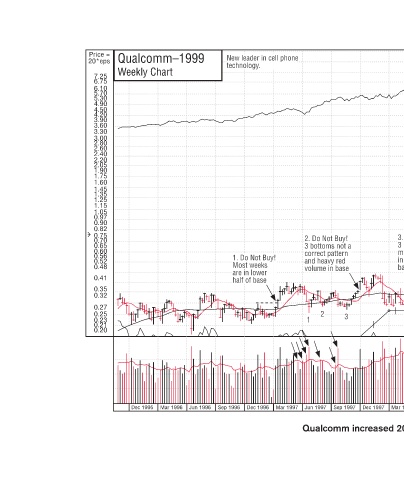
Dec 1997 Mar 2000 Dec 1999 Sep 1999 Jun 1999 Mar 1999 Dec 1998 Sep 1998 Jun 1998 Mar 1998 © 2009 Investor’s Business Daily, Inc. Qualcomm increased 2091% in 45 weeks.
2. Do Not Buy! 2. Do Not Buy! t 3 bottoms not a correct pattern correct pattern a and heavy red and heavy red y volume in base n 2 2 3 3 1 Sep 1997 Jun 1997
New leader in cell phone p e e technology. o 1. Do Not Buy! y Most weeks k s M are in lower are in lower i of base half of base half Mar 1997 Dec 1996 Sep 1996
e
Qualcomm–1999 Weekly Chart Jun 1996 Mar 1996 Dec 1995
Price = 20*eps 7.25 6.75 6.10 5.70 5.30 4.90 4.50 4.20 3.90 3.60 3.30 3.00 2.80 2.60 2.40 2.20 2.05 1.90 1.75 1.60 1.45 1.35 1.25 1.15 1.05 0.97 0.90 0.82 0.75 0.70 0.65 0.60 0.56 0.52 0.4