
Page 208 - How to Make Money in Stocks Trilogy
P. 208
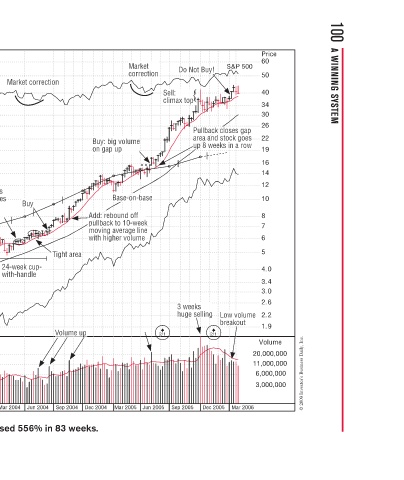
100  A WINNING SYSTEM


          Price  60  50  40  34  30  26  22  19  16  14  12  10  8  7  6  5  4.0  3.4  3.0  2.6  2.2  1.9  Volume  20,000,000  11,000,000  6,000,000  3,000,000  © 2009 Investor’s Business Daily, Inc.

            S&P 500    ck closes gap   s  s  s  s and stock goes a and stock goes  k  c  up 8 weeks in a row p 8 weeks in a row  a  i  Low volume  Low volume  v  w  breakout  k  e  Mar 2006


             Do Not Buy! Do Not Buy!  y  y  N  x top  o  ack c Pullback c  k  k  u  ea an  a  area a  area  e  w  up 8  p  p  up  p  s 3 weeks  e  huge selling  g huge selling huge selling  g  g  e  2/1  Dec 2005

             D
                 Sell:  Sell:  e  climax top  i     3  h             Sep 2005
                                                         2/1         Jun 2005
              o
            Market  k  M  correction correction  r  c  e  m  e  e  e  eonbase  e-on-base  b  o  o  k  e  -  e  g  m  l
                         Buy: big volume  l  o  big  y  on gap up on gap up  g  Base-o  se-o  Base  s  B  d: rebound off  bound off  n  d: rebo  pullback to 10-week  b  moving average line  a  i  with higher volume with higher volume  h  Mar 2005

                                     Add:
                                     dd:
                                     Add
                          o
                                     d
                         B
                         B
                                      pu
                                      pu
                                      pu
                                        m
                                     A
                                         w
                                                         p           Dec 2004
                                            Tight area  Tight area  r  Volume up  u  Sep 2004
               Market correction  e  Buy  B   24-week cup-  k cup  eek  k  24  with-handle  n  Jun 2004 Mar 2004
               n  o                         gh  T
                                 Note: tiny spreads for 4 weeks   e  n and then 2 weeks (sound bases and then 2 weeks (sound bases  a  n need a few weeks with small l  w  e  ) price variation)  )  r  Dec 2003 Sep 2003 Southwestern Energy increased 556% in 83 weeks.


                               ck in  g  ki  B  2  22  4  e  So you understand  e  p  p  Jun 2003 Mar 2003 Dec 2002
                            base patterns like

           Southwestern Energy–2004  Weekly Chart  Now you’ve seen several base-on-base patterns like   n  on Now you ve seen several base  r  s this one. Compare it to IBM in 1927 on page 19,  9  m Minneapolis Honeywell in 1934 on page 22, Brunswi i  1934 o  ll i  l  H  H  li 1958 on page 31, National Airlines in
                            tt


          Price =  20*eps   2.50     2.25     2.00    1.80    1.60   1.50      1.40    1.30     1.20     1.10    1.00     0.90   w   0.80    0.75  s   0.70  Min   0.65  5   0.60          0.55    m   0.50   a   0.45    0.40    0.35    0.30    0.25    0.23    0.20    0.18    0.16    0.15    0.14    0.13    0.12    0.