
Page 212 - How to Make Money in Stocks Trilogy
P. 212
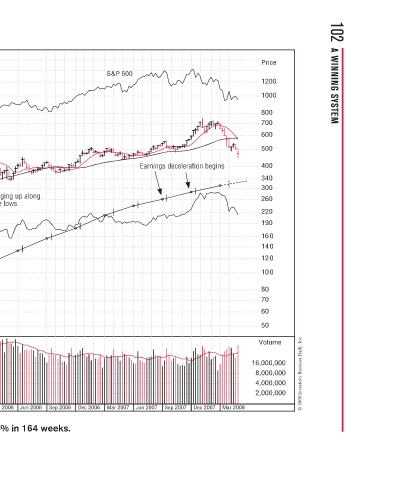
102  A WINNING SYSTEM


            Price  1200  1000  800  700  600  500  400  340  300  260  220  190  160  140  120  100  80  70  60  50  Volume  16,000,000  8,000,000  4,000,000  2,000,000  © 2009 Investor’s Business Daily, Inc.

                                                                     Mar 2008

                             Earnings deceleration begins Earnings deceleration begins  n  a  l  Sep 2007
                             s  s  n  e                              Dec 2007


              S&P 500        n  E                                    Jun 2007 Mar 2007


                                                                     Dec 2006
                                                                     Sep 2006


                                  Wedging up along   p  gg u  price lows  Jun 2006 Mar 2006
                                  g


                        !         W  p  closes and  d  n  points  points  Dec 2005 Google increased 536% in 164 weeks.
                        Do Not Buy!  o  t clo  p  2  12
           o  so  m         Add        3 weeks tight clo  w  3  shakeout + 12  shakeout + 12  a  osing in   i  g  losin  i  d  d  week and h week and  k  h w  lume which  h  lume without  ume without  h  p  s  s  Sep 2005
           Whole new revolutionary concept in its industrys Whole new revolutionary concept in its industry s  t  y  e it dominates in the space for instant information.  a  c  p  i  o  Do Not Buy! 2 largest t  !2l  tB  N  e volume weeks in base volume weeks in base  k  l  are down weeks  e  Buy  Buy  y  Buy  B  2


           Google–2004  Weekly Chart  Do  e           Volume dry-up  y  o  on price pullback on price pullback  n  Jun 2004 Mar 2004 Dec 2003


          Price =  20*eps  70  65  60  55  50  45  40  35  30  25  22  20  18  16  15  14  13  12  11  10   9.00    8.00    7.50    7.00    6.50    6.00    5.50    5.00    4.50    4.00    3.50    3.00    2.50