
Page 224 - How to Make Money in Stocks Trilogy
P. 224
108 A WINNING SYSTEM
Price 400 340 300 260 220 190 160 140 120 100 80 70 60 50 40 34 30 26 22 19 16 Volume 12,000,000 7,000,000 4,000,000 2,000,000 © 2009 Investor’s Business Daily, Inc.
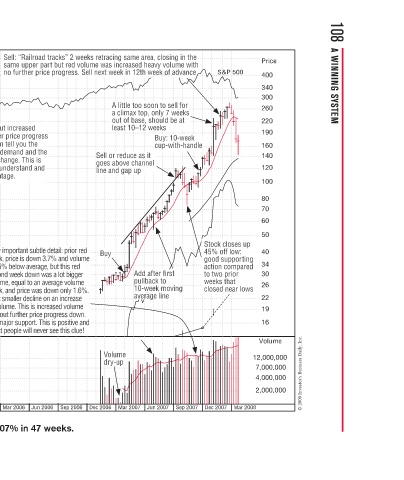
S&P 500 Stock closes up s 45% off low: 45% off low: o o good supporting p p s action compared action compared m to two prior to two prior i weeks that a closed near lows l e d d Mar 2008 Dec 2007
e e closing in the e n n o h e u v a e e va eek of adv ad a a k of eek k A little too soon to sell for o e o o a climax top, only 7 weeks e w y o out of base, should be at t should be at b u h k e Buy: 10-week k w 0 y cup-with-handle handle with- i p cup o
Sell: “Railroad tracks” 2 weeks retracing same area, closing in the 2 weeks retracing same area r m s n r r w Railroad tracks” c same upper part but red volume was increased heavy volume wit t h s r n w e u r nofurther price progress. Sell next week in 12th week of advance h 1 e t n
p
These comments about increased e u m volume without further price progress o i the t f h ith l o in the current direction tell you the in the current direction tell you the t n n results of supply and demand and the n d u direction is about to change. This is a valuable to l
p
e
i
Sell:
e
n
w
T
Huge quarterly sales Huge quarterly sales s q growth and EPS growth. growth and EPS growth. S h High P/E ratio doesn’t P/ stop stock’s move from f o k’ t t t 20 to 280 2 Jun 2005 Mar 2005 Dec 2004
Sep 2004
Jun 2004
First Solar–2007 Weekly Chart Mar 2004 Dec 2003
Price = 20*eps 20 18 16 15 14 13 12 11 10 9.00 8.00 7.50 7.00 6.50 6.00 5.50 5.00 4.50 4.00 3.50 3.00 2.50 2.25 2.00 1.80 1.60 1.50 1.40 1.30 1.20 1.10 1.00 0.90 0.80 0.75