Page 301 - How to Make Money in Stocks Trilogy
P. 301

178  A WINNING SYSTEM


                     America Online                         Price
                                                            160
                     Weekly Chart                           140
                                                            120
                                                            100
                                                            80
                                                            70
                                                            60
                                                            50
                                        Buy pointoy
                                                            40
                                                            34
                                                            30
                                                            26
                                                            22
                                                            19
                                                            16
                                                            14
                                 2/1            2/1  2/1
                                                            Volume © 2009 Investor’s Business Daily, Inc.
                                                          80,000,000
                                                          40,000,000
                                                          20,000,000
                        Dec 1997  Mar 1998  Jun 1998  Sep 1998  Dec 1998  Mar 1999  Jun 1999
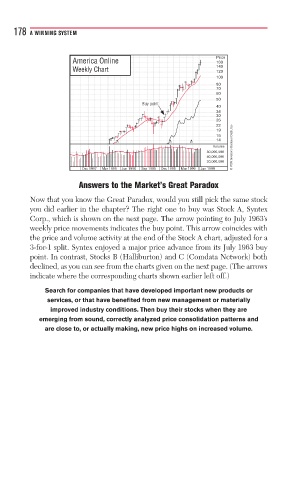
                       Answers to the Market’s Great Paradox
          Now that you know the Great Paradox, would you still pick the same stock
          you did earlier in the chapter? The right one to buy was Stock A, Syntex
          Corp., which is shown on the next page. The arrow pointing to July 1963’s
          weekly price movements indicates the buy point. This arrow coincides with
          the price and volume activity at the end of the Stock A chart, adjusted for a
          3-for-1 split. Syntex enjoyed a major price advance from its July 1963 buy
          point. In contrast, Stocks B (Halliburton) and C (Comdata Network) both
          declined, as you can see from the charts given on the next page. (The arrows
          indicate where the corresponding charts shown earlier left off.)

              Search for companies that have developed important new products or
               services, or that have benefited from new management or materially
               improved industry conditions. Then buy their stocks when they are
            emerging from sound, correctly analyzed price consolidation patterns and
              are close to, or actually making, new price highs on increased volume.
   296   297   298   299   300   301   302   303   304   305   306