
Page 308 - How to Make Money in Stocks Trilogy
P. 308
S = Supply and Demand: Big Volume Demand at Key Points 185
jump 40% or 50% above normal. In many cases, it will be 100% or more that
day, indicating solid buying and likely further price increases. Using daily,
weekly, and monthly charts helps you analyze and interpret a stock’s price
and volume action.
You should analyze a stock’s base pattern week by week, beginning with
the first week a stock closes down in a new base and continuing each week
until the current week, where you think it may break out of the base. You
judge how much price progress up or down the stock made each week and
whether it was on increased or decreased volume from the prior week. You
also note where the stock closed within the price spread of each week’s
high and low. You do both a week-by-week check and evaluate the pattern’s
overall shape to see if it is sound and under accumulation or if it has too
many defects.
Apple ROE—27E—2 % Price
Prettax mmx argingg (a( nnun al))a —21— %%% 400
Weekly Chart Leaading prding odud ct
S&P 500 340
300
260
2 2 4weekse in a roww 220
tightg closc ing priig p ces
190
160
140
New Leader Ideaer IdL 120
N
3 A Apple has 3
w w wavesavess ddoownwnw aaass 100
S S&P 5005 f falls
80
S S&P&P& 500 5000 ccrrasashhesese ttoo nneewww lolowwss bbutut AAppppllee 70
4 4 4 h holoo ddss aaabboveovee ititss loloowwss... RRelaelaatitiveveve sstrtreengtngthh 60
linnne neaars new highw highiw highss asas SSSSS&P&P 500 t5 anks.
B Beaeaar mr maaarrkekett eendndndnndssssss MaMaaMaMarrrrcccch 2009h 200992h20h20 .. SS&P&PP 500 5000 fellfelll 58%,58%, lealeaddeerrrss 45
H H
Heav
1 1 1 1 Heaviiesest rtreeddd volvololummuuuuumeee in 5in 5n5nin 5 yeayeay aaarrrssssss, off 60%% aandnd comingm off loows ofo pottentiala deee p cup basess
b b b but nut noo ffuurrthththttheeeeeer prir prirrr ce ce prprroogrgresese ss 38
doownwn (b(big innigig stitutiu onala suppp orrt l l l liiikeekekeeke CCChhhhhrrysleysley r r aand Xnd Xeerroxoxo in 1962, in 19622xx a and Lnd Ld oeoeewwss in 1966 in 1966 (se(seeeee
b buuyyy ginging))) p paagggeses 38388,, 41,41,1 aand 47nd 47d 47).). DDaaiiilyly cchhhaarrt undt undu eerrrccututsss 8686 loloww ofof 2222 32
weekse befoe ree and thd eenralllies 6 pp6 ointn s too 92, ,, a new buyy 28
point andd aboveo 10-w avev ragge.
10-week mmk ovingi
Volume
140,000,000
80,000,000
40,000,000
20,000,000
Mar 2008 Jun 2008 Sep 2008 Dec 2008 Mar 2009 Jun 2009 Sep 2009 Dec 2009
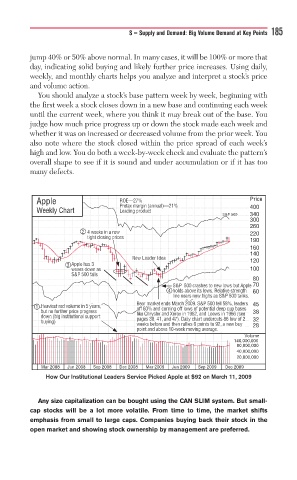
How Our Institutional Leaders Service Picked Apple at $92 on March 11, 2009
Any size capitalization can be bought using the CAN SLIM system. But small-
cap stocks will be a lot more volatile. From time to time, the market shifts
emphasis from small to large caps. Companies buying back their stock in the
open market and showing stock ownership by management are preferred.