
Page 34 - How to Make Money in Stocks Trilogy
P. 34
America’s Greatest Stock-Picking Secrets 13
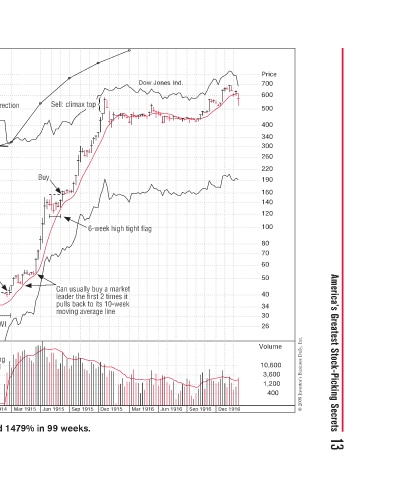
Price 700 600 500 400 340 300 260 220 190 160 140 120 100 80 70 60 50 40 34 30 26 Volume 10,600 3,600 1,200 400 © 2009 Investor’s Business Daily, Inc.
Dec 1916
Sep 1916
Dow Jones Ind. g g a Jun 1916 Mar 1916
6-week high tight flag high tight fla t i week h g k t t a mes it i t t k k w 0 t n Dec 1915
Sell: climax top top o a l w 6 6 Can usually buy a market u y a a leader the first 2 times it leader the first 2 time i h e e pulls back to its 10-week t c s moving average line g e a Sep 1915
S
S
Buy B
y e pu m Jun 1915
Mar 1915
i
an h r Market correction ke Buy I month base during WW 8-month base during WW Market e g closed during d World War I I World War d Dec 1914 Sep 1914 Bethlehem Steel increased 1479% in 99 weeks.
Bethlehem Steel produced about 60% of the t t Allies’ munitions during World War I. America W g steelmakers chose to stabilize profits for pr s c domestic contracts so foreign orders r n accounted for most of the profits. fits f th t t d fo Quarter by quarter plot of Quarter by quarter p
t
i
m
e
c
t
Sep 1913 Dec 1913 Jun 1913
Bethlehem Steel–1914 Weekly Chart Mar 1913 Dec 1912 Sep 1912
Price = 10*eps 242 80 70 60 50 45 40 36 32 30 28 26 24 22 20 18 16 15 14 13 12 11 10 9.00 8.00 7.00 6.00 5.00 4.50 4.00 3.60 3.20 3.00 2.80 2.60 2.40