
Page 38 - How to Make Money in Stocks Trilogy
P. 38
America’s Greatest Stock-Picking Secrets 15
Price 100 80 70 60 50 40 34 30 26 22 19 16 14 12 10 8 7 6 4.5 3.8 Volume 65,000 30,000 12,200 5,600 2,600 © 2009 Investor’s Business Daily, Inc.
10/1 Mar 1926
x.
. v r k o s x d i t k a Dec 1925
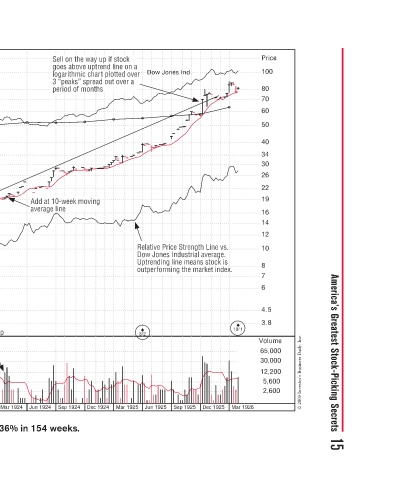
Dow Jones Ind. Relative Price Strength Line vs. Relative Price Strength Line vs t n S c P Dow Jones Industrial average. r u n Uptrending line means stock is e g outperforming the market index h t i i f Sep 1925 Jun 1925
r o r otted ove v d a e t e o e p e u 3/2 Mar 1925
Sell on the way up if stock Sell on the way up if stock p y t S S S goes above uptrend line on a l n t e o s g logarithmic chart plotted ove o logarithmic chart plo a c m a o 3 “peaks” spread out over a t o a s s 3 period of months period of months s t o m od o o o o o
c
average line
Add at 10
average l
g
Mar 1924 Jun 1924
p u
Volume up olume up S.S. Kresge increased 836% in 154 weeks.
n e n n s 2 r r Market correction Market correction n n o t Buy - - - 22-week saucer- 22-week saucer- e with-handle h Dec 1923 Sep 1923
The mid-1920s was a transition period from The mid-1920s was a transition period from s w d mom-and-pop corner stores to business-owned e o n Kresge grew from 233 stores in retail chains. S.S. Kresge grew from 233 stores in r S S. retail chains h 1924 to 451 stores just 4 years later. e e o
o
S.S. Kresge–1923 Weekly Chart Earnings per share e a acceleration acceleration n c o 3/2 Jun 1922 Mar 1922 Dec 1921
Price = 20*eps 5.00 4.50 4.00 3.50 3.00 2.50 2.25 2.00 1.80 1.60 1.50 1.40 1.30 1.20 1.10 1.00 0.90 0.80 0.75 0.70 0.65 0.60 0.55 0.50 0.45 0.40 0.35 0.30 0.25 0.23 0.20 0.18