Page 392 - How to Make Money in Stocks Trilogy
P. 392

k
                                           Sl
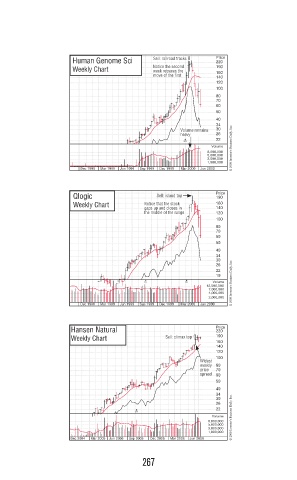
                     Human Genome Sci      S S Sell: railroad tracksll  il ilroa d t acks  Price
                                                            220
                                           Notice the second the secondothe st
                     Weekly Chart          Notice           190
                                           week retraces the tetrace
                                                            160
                                           move of the firstsof theove o  140
                                                            120
                                                            100
                                                            80
                                                            70
                                                            60
                                                            50
                                                            40
                                                            34
                                                   V Volume remainsolume remainsme reml  s s  30
                                                   heavy y  26
                                                   heavya
                                                            22
                                                    2/1
                                                           Volume © 2009 Investor’s Business Daily, Inc.
                                                          8,000,000
                                                          5,000,000
                                                          3,000,000
                                                          1,800,000
                        Dec 1998  Mar 1999  Jun 1999  Sep 1999  Dec 1999  Mar 2000  Jun 2000
                      Qlogic                Sell: i  p p    Price
                                            Sell: island topon
                                                            190
                                         Notice
                      Weekly Chart       Notic              160
                                         N
                                         Notice that the stock that the stockkshat th
                                         gaps up and closes inup and closes iniop and s
                                         g gaps             140
                                         the middle of the rangeof the rangene
                                         the                120
                                         the middle of the rangeemiddledle omh
                                                            100
                                                            80
                                                            70
                                                            60
                                                            50
                                                            40
                                                            34
                                                            30
                                                            26
                                                            22
                                                            19
                                         2/1        2/1    Volume © 2009 Investor’s Business Daily, Inc.
                                                          12,000,000
                                                          7,000,000
                                                          4,000,000
                                                          2,000,000
                        Dec 1998  Mar 1999  Jun 1999  Sep 1999  Dec 1999  Mar 2000  Jun 2000
                     Hansen Natural                         Price
                                                            220
                                               Sell: climax topclimax topmax toce
                     Weekly Chart              Sell:  opp   190
                                                            160
                                                            140
                                                            120
                                                            100
                                                        Widest
                                                        weekly
                                                        weekly  80
                                                        price  70
                                                        price
                                                         p spread
                                                        spread  60
                                                            50
                                                            40
                                                            34
                                                            30
                                                            26
                                                            22
                                      2/1
                                                           Volume © 2009 Investor’s Business Daily, Inc.
                                                          8,000,000
                                                          5,000,000
                                                          3,000,000
                                                          1,800,000
                     Dec 2004  Mar 2005  Jun 2005  Sep 2005  Dec 2005  Mar 2006  Jun 2006
                                        267
   387   388   389   390   391   392   393   394   395   396   397