
Page 393 - How to Make Money in Stocks Trilogy
P. 393
268 BE SMART FROM THE START
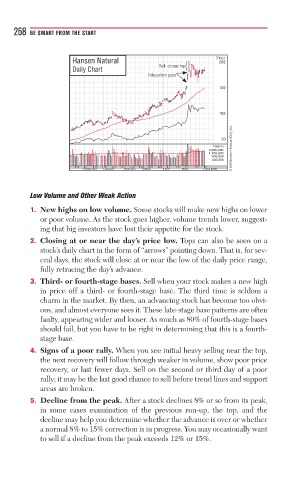
Hansen Natural Price
200
Se
Seel ll: climax topomax p p
ll: climax top
l
Daily Chart
Exhaustioostioo o on gaps
Exh
on gapsa
150
100
© 2009 Investor’s Business Daily, Inc.
50
Volume
2,000,000
1,100,000
600,000
300,000
18 2 16 30 13 27 10 24 10 24 7 21 5 19 2
December January February March Apri May June 2006
Low Volume and Other Weak Action
1. New highs on low volume. Some stocks will make new highs on lower
or poor volume. As the stock goes higher, volume trends lower, suggest-
ing that big investors have lost their appetite for the stock.
2. Closing at or near the day’s price low. Tops can also be seen on a
stock’s daily chart in the form of “arrows” pointing down. That is, for sev-
eral days, the stock will close at or near the low of the daily price range,
fully retracing the day’s advance.
3. Third- or fourth-stage bases. Sell when your stock makes a new high
in price off a third- or fourth-stage base. The third time is seldom a
charm in the market. By then, an advancing stock has become too obvi-
ous, and almost everyone sees it. These late-stage base patterns are often
faulty, appearing wider and looser. As much as 80% of fourth-stage bases
should fail, but you have to be right in determining that this is a fourth-
stage base.
4. Signs of a poor rally. When you see initial heavy selling near the top,
the next recovery will follow through weaker in volume, show poor price
recovery, or last fewer days. Sell on the second or third day of a poor
rally; it may be the last good chance to sell before trend lines and support
areas are broken.
5. Decline from the peak. After a stock declines 8% or so from its peak,
in some cases examination of the previous run-up, the top, and the
decline may help you determine whether the advance is over or whether
a normal 8% to 15% correction is in progress. You may occasionally want
to sell if a decline from the peak exceeds 12% or 15%.