
Page 402 - How to Make Money in Stocks Trilogy
P. 402
Money Management 277
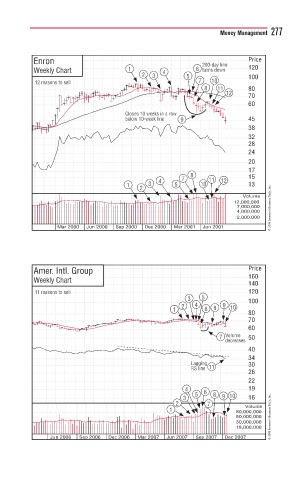
Enron 200-day liney0 e Price
Weekly Chart 1 4 6 tu t rns downdon 120
2 3 5 100
1
12 reasons to sellseasons 7 10
8 11 80
12
70
60
Closes 10 weeks in a rowin a ro0weo w
below 10-week line10 week linen0-wee
below 9 45
38
32
28
24
20
17
8
7 11 12 15
4
1 3 5 10 13
2
Volume
12,000,000
7,000,000 © 2009 Investor’s Business Daily, Inc.
4,000,000
2,000,000
Mar 2000 Jun 2000 Sep 2000 Dec 2000 Mar 2001 Jun 2001
Amer. Intl. Group Price
Weekly Chart 160
140
11
11 reasons to sellreasons to sellsasons 120
3 5 100
2 4 9 10
1 6 8
80
70
60
7 Volume 50
d
decreases
40
34
L Lagginggg gg 30
S
RS line e 11
R
26
22
4 6 19
5 8
3 9 10 16
2 7
Volume
1 80,000,000
50,000,000 © 2009 Investor’s Business Daily, Inc.
30,000,000
18,000,000
Jun 2006 Sep 2006 Dec 2006 Mar 2007 Jun 2007 Sep 2007 Dec 2007