
Page 477 - How to Make Money in Stocks Trilogy
P. 477
How I Use IBD to Find Potential Winning Stocks 347
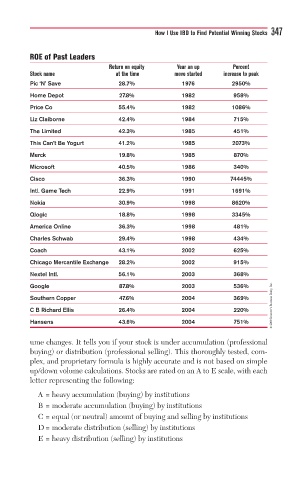
ROE of Past Leaders
Return on equity Year an up Percent
Stock name at the time move started increase to peak
Pic ‘N’ Save 28.7% 1976 2950%
Home Depot 27.8% 1982 958%
Price Co 55.4% 1982 1086%
Liz Claiborne 42.4% 1984 715%
The Limited 42.3% 1985 451%
This Can’t Be Yogurt 41.2% 1985 2073%
Merck 19.8% 1985 870%
Microsoft 40.5% 1986 340%
Cisco 36.3% 1990 74445%
Intl. Game Tech 22.9% 1991 1691%
Nokia 30.9% 1998 8620%
Qlogic 18.8% 1998 3345%
America Online 36.3% 1998 481%
Charles Schwab 29.4% 1998 434%
Coach 43.1% 2002 625%
Chicago Mercantile Exchange 28.2% 2002 915%
Nextel Intl. 56.1% 2003 368%
© 2009 Investor’s Business Daily, Inc.
Google 87.8% 2003 536%
Southern Copper 47.6% 2004 369%
C B Richard Ellis 26.4% 2004 220%
Hansens 43.6% 2004 751%
ume changes. It tells you if your stock is under accumulation (professional
buying) or distribution (professional selling). This thoroughly tested, com-
plex, and proprietary formula is highly accurate and is not based on simple
up/down volume calculations. Stocks are rated on an A to E scale, with each
letter representing the following:
A = heavy accumulation (buying) by institutions
B = moderate accumulation (buying) by institutions
C = equal (or neutral) amount of buying and selling by institutions
D= moderate distribution (selling) by institutions
E = heavy distribution (selling) by institutions