
Page 508 - How to Make Money in Stocks Trilogy
P. 508
How I Use IBD to Find Potential Winning Stocks 377
© 2009 Investor’s Business Daily, Inc.
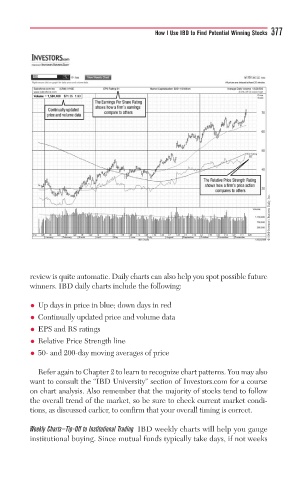
review is quite automatic. Daily charts can also help you spot possible future
winners. IBD daily charts include the following:
• Up days in price in blue; down days in red
• Continually updated price and volume data
• EPS and RS ratings
• Relative Price Strength line
• 50- and 200-day moving averages of price
Refer again to Chapter 2 to learn to recognize chart patterns. You may also
want to consult the “IBD University” section of Investors.com for a course
on chart analysis. Also remember that the majority of stocks tend to follow
the overall trend of the market, so be sure to check current market condi-
tions, as discussed earlier, to confirm that your overall timing is correct.
Weekly Charts—Tip-Off to Institutional Trading IBD weekly charts will help you gauge
institutional buying. Since mutual funds typically take days, if not weeks