Page 632 - How to Make Money in Stocks Trilogy
P. 632

© 2009 Investor’s Business Daily, Inc.
                                                                   200,000
                                                              1,600,000
                                                                 400,000
                                                                800,000
                                                                     June 1999
                                                                     Ma y
                                                                     Apri l
                                                                     March
                                                                     February
                                                                     January
                                                                     December
                                                                   2,000,000
                                                             12,000,000
                                                               7,000,000
                                                                 4,000,000
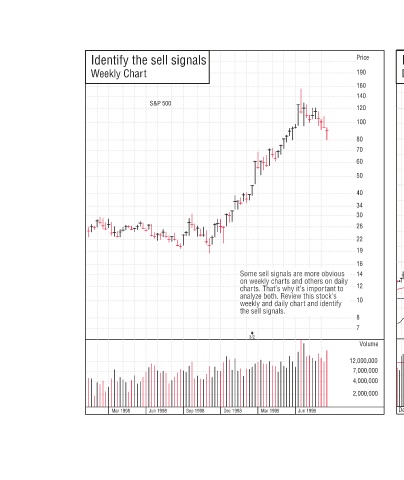
           Price  Price Identify the sell signals  190 Daily Chart  160  140  120  150  100  80  70  60  50  100  40  34  30  26  22  19  50  16  14  12  tant to  10  tif  8  7  Volume  Volume  Test Your Knowledge  465
                                               Some sell signals are more obvious  Some sell signals are more obvious  m  a  a  s on weekly charts and others on daily  s  t  r  c charts. That’s why it’s important to   o it’s impo  m  h That’s w  a analyze both. Review this stock’s   t  i  e  R  t weekly and daily c
                                                e
                                                    kly
                                                     l
                                                 ts
                                                   z
                                                 s
                                                         3/2
                                                 cha
                                                    e
                                                     e
                                                n
                                               o
                                                   n
                                                 h
                                                                     Dec 1998 Sep 1998
            Identify the sell signals  Weekly Chart  S&P 500         Jun 1998 Mar 1998
   627   628   629   630   631   632   633   634   635   636   637