
Page 637 - How to Make Money in Stocks Trilogy
P. 637
Test Your Knowledge 467
Price 50 40 30 20 10 Volume 13,000,000 7,000,000 4,000,000 2,000,000 © 2009 Investor’s Business Daily, Inc.
August 2006
July
June
May
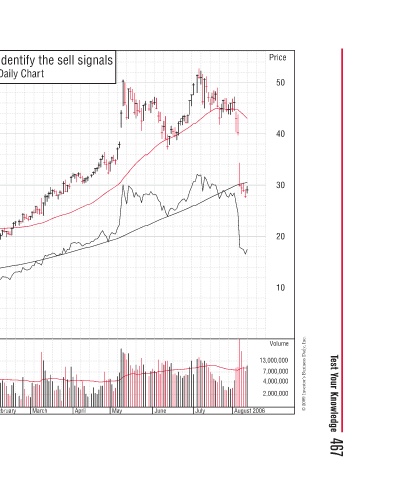
Identify the sell signals Daily Chart April March
Price 46 36 27 23 19 16 13 11 9 7 6 4.6 3.6 2.7 2.3 2.0 1.6 1.4 1.1 0.9 Volume 16,000,000 8,000,000 4,000,000 2,000,000 February Sep 2006
Some sell signals are more obvious on weekly charts and others on daily charts. That’s why it’s important to analyze both. Review this stock’s weekly and daily chart and identify the sell signals. 4/1 Jun 2006 Mar 2006
Dec 2005
Identify the sell signals Weekly Chart S&P 500 2/1 Sep 2005 Jun 2005 Mar 2005