Page 65 - How to Make Money in Stocks Trilogy
P. 65

© 2009 Investor’s Business Daily, Inc.
                                                                 30,000
                                                                  18,000
                                                          Volume
                                                             80,000
                                                               50,000
                                                       4.5
                                                   6
                                                 7
                                               8
                                                                     Dec 1956
                                                                     Sep 1956
                                                                     Jun 1956
                                                                     Mar 1956
                                                                     Dec 1955
                                                                     Sep 1955
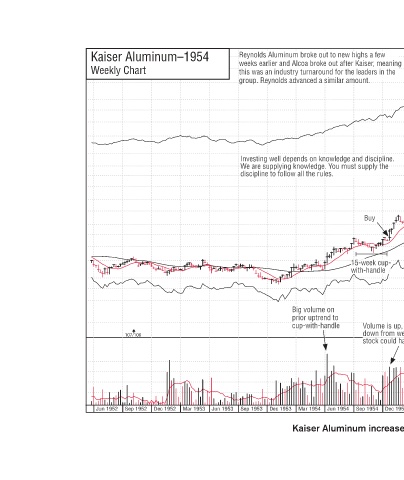
                                                                         Kaiser Aluminum increased 379% in 93 weeks.
                                                         3/1
                                                                     Jun 1955
                                                         e
                                                         down from week before, the
                                                       n
                                                       Volume is up, if it had been
                                                         h
                                                                     Mar 1955
                                                         ,
                                                          stock could have failed
                                                         b
                                                          f
                                                       t
                                                                     Dec 1954
            g Price  w  e  r  r  120 Dow Jones Ind.  n  100  80  70  60  50  40  e.  l  34  h  30 This is the 200-day  day  a  0 This is the 200  e  s  T  moving average line.  e  l  g  g  v  g  g  v  m  26 A longer-term line.  e  e  n  A  22  19  Buy  16  14 10-week moving  n  o  w  0  1  12 age line of prices ave
           Reynolds Aluminum broke out to new highs a few  Reynolds Aluminum broke out to new highs a few  h  u  m weeks earlier and Alcoa broke out after Kaiser, meanin  e  A this was an industry turnaround for the leaders in the   e  u  y group. Reynolds advanced a similar amount. group. Reynolds advanced a simil
                                                       e
                                                          c
                                                         f
                                                                     Sep 1954
                             u
            r
                              e
               e
               Re
             a
                              p
               group
                                                                     Jun 1953 Sep 1953 Mar 1953
           Kaiser Aluminum–1954  Weekly Chart            107/100     Dec 1952 Sep 1952 Jun 1952
   60   61   62   63   64   65   66   67   68   69   70